Dashboard
Monitor your entire fleet at a glance with the Yipii IoT dashboard. Track fleet status, driver behavior scores, alerts, and distance trends.
Dashboard
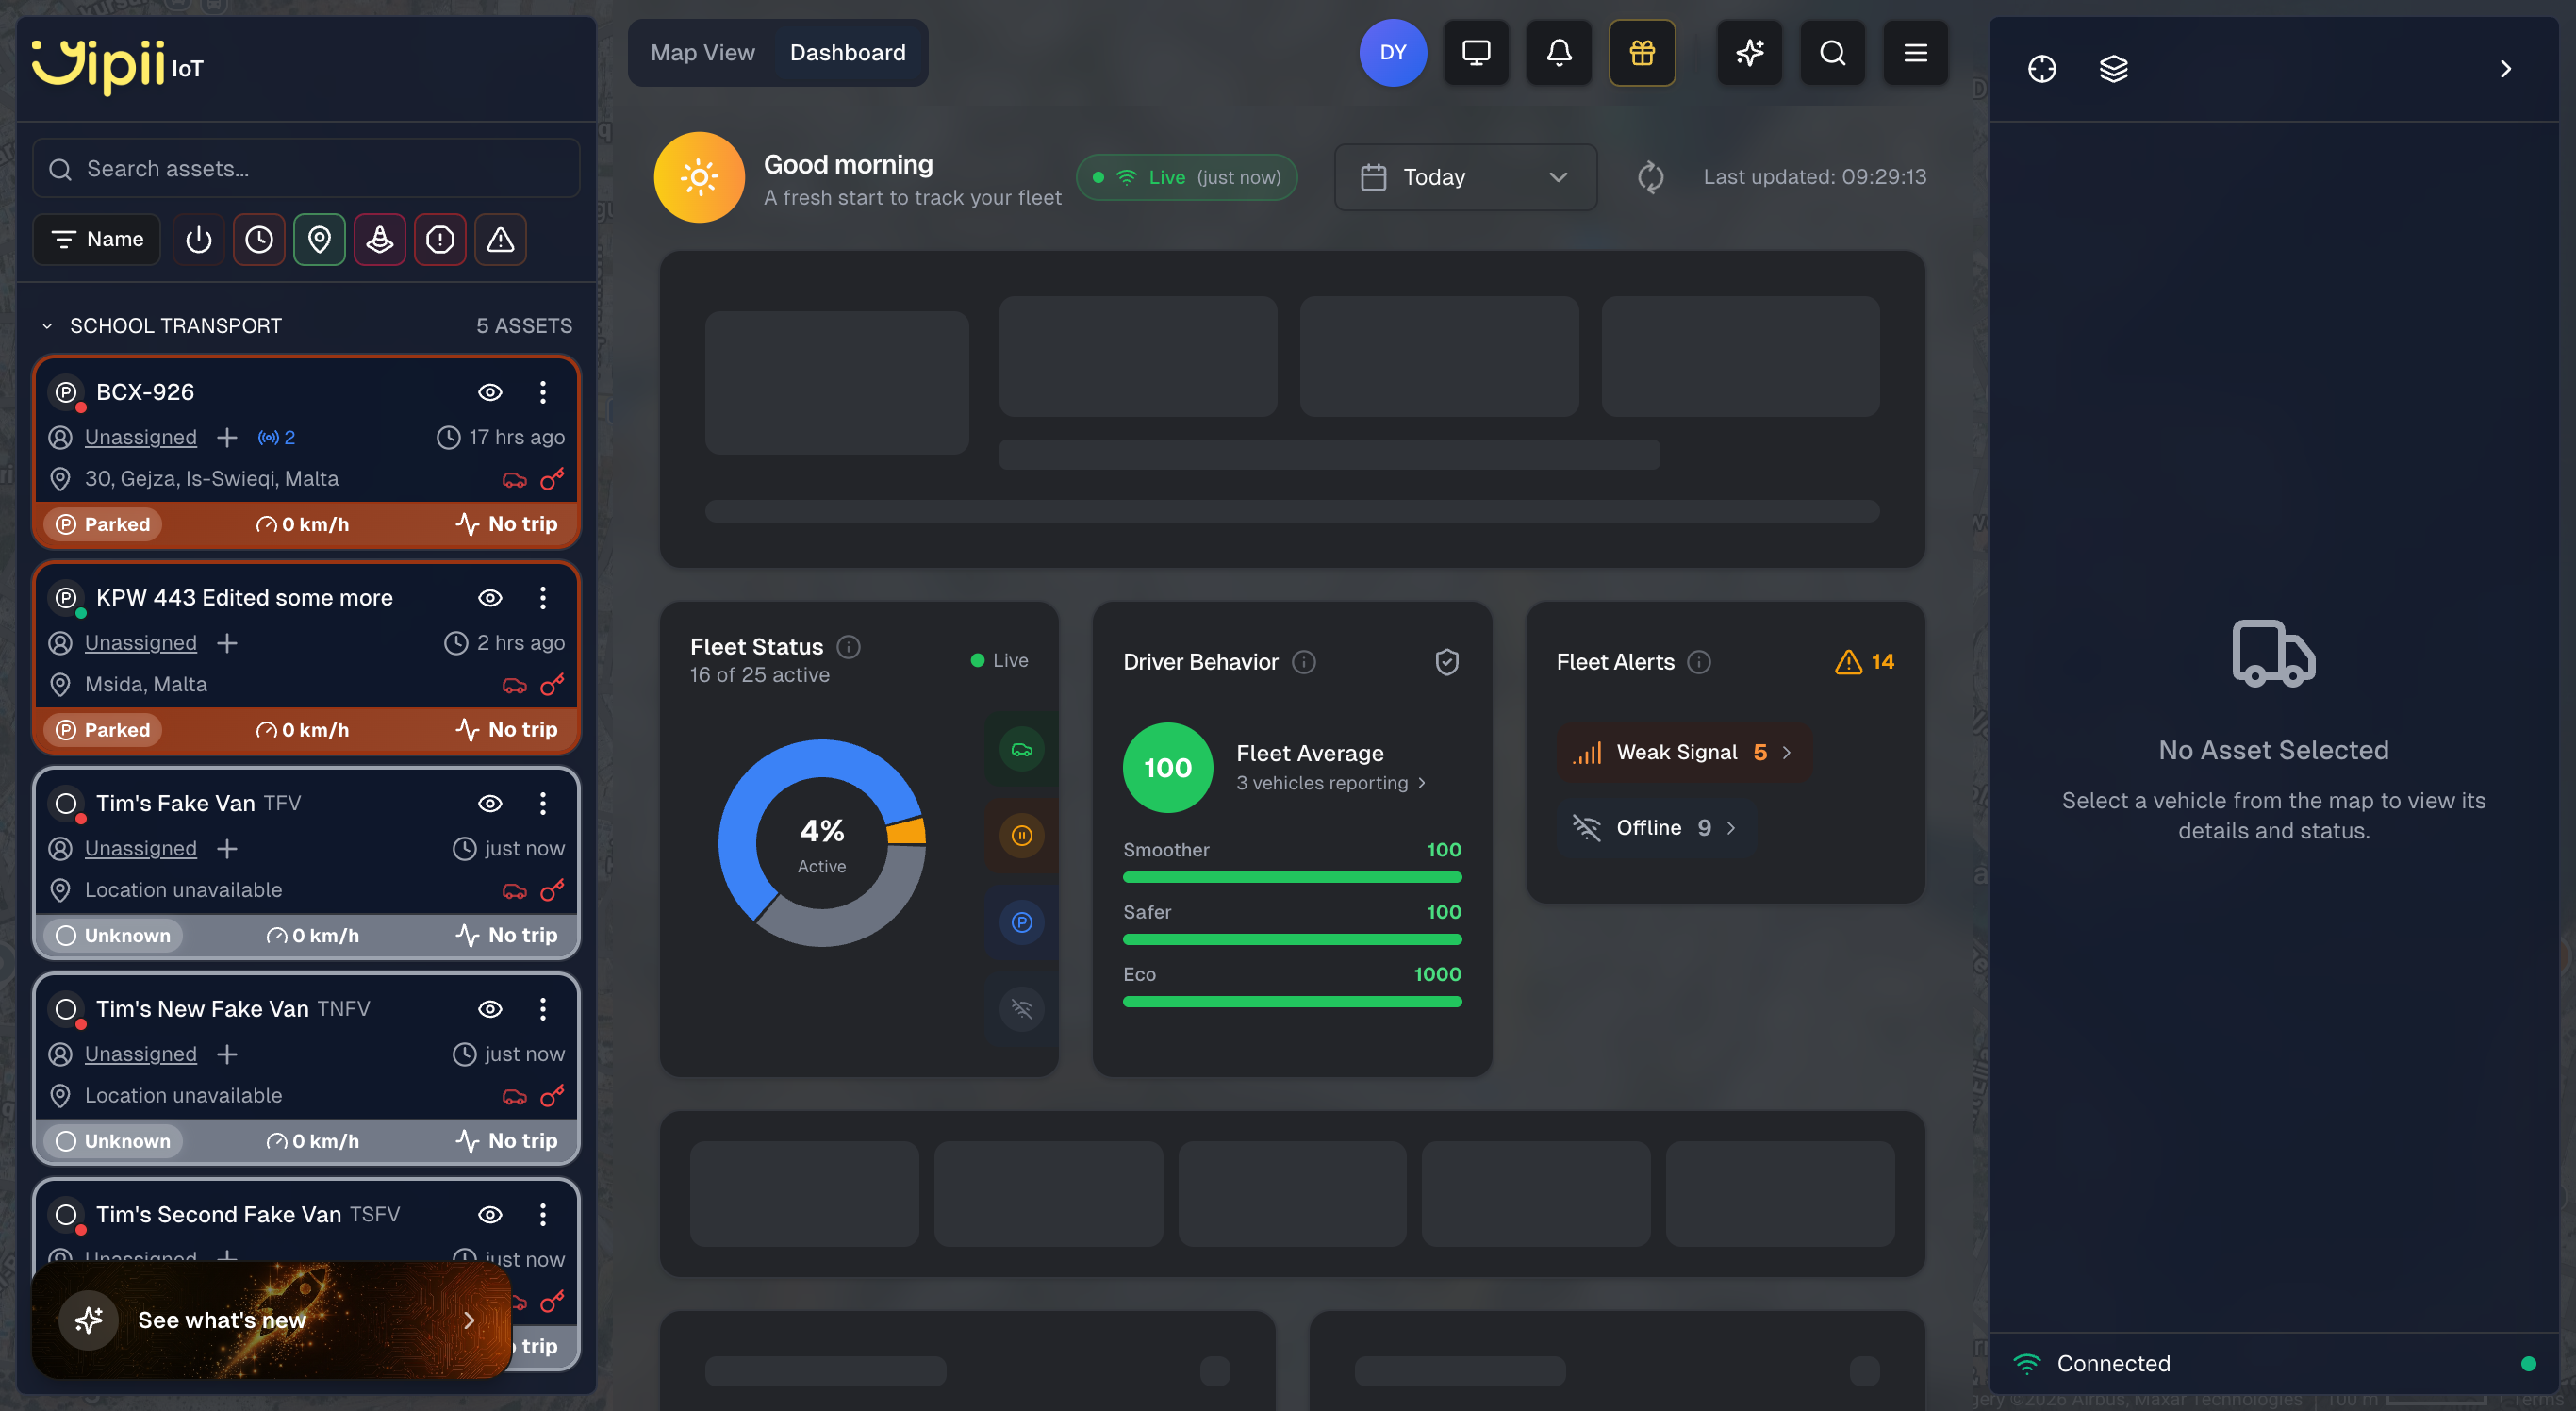
The Dashboard is a tab in the top tab bar, alongside Map View. Click the Dashboard tab to switch from the map and see a card-based overview of your fleet's health, driver performance, and alerts.
Greeting and Time Context
When you open the dashboard, a greeting at the top reflects the time of day — "Good morning" or "Good afternoon" — along with a short subtitle like "A fresh start to track your fleet." This provides a quick orientation each time you check in.
Time Period Filters
At the top of the dashboard you will find two toggle buttons: Last week and Today. Select one to control the time range for all cards and charts below. A Last updated timestamp shows when the data was last refreshed, so you always know how current the numbers are.
Fleet Status
The Fleet Status card displays a donut chart showing the percentage of your fleet that is currently active. Below the chart you will see a count such as "X of Y active," giving you an immediate answer to the most common fleet question: how many vehicles are on the road right now? The chart segments are color-coded by status category — Moving, Idle, Parked, Offline, and other statuses.
Driver Behavior
The Driver Behavior card shows your fleet's average driving score on a 0-to-100 scale, along with a letter grade, for the selected time period. Four component bars break the score down into specific categories:
- Smoothness — how smoothly drivers accelerate and decelerate
- Braking — frequency and severity of harsh braking events
- Idling — amount of time spent with the engine running while stationary
- Eco — overall fuel-efficient driving habits
Use this card to spot coaching opportunities. If the Braking bar is consistently low, for example, it may be worth running a driver safety session focused on following distance and anticipation.
Fleet Alerts
The Fleet Alerts card summarizes active alerts across your fleet by type. Each alert type is shown with a colored indicator and a count — for example, "Weak Signal: 3" or "Offline: 2." This gives you a quick triage view so you can identify which issues need attention without opening the full Alerts page.
Trend Charts
Two trend charts appear at the bottom of the dashboard:
Distance Trend
A chart showing total distance traveled across your fleet over the selected period. Spot patterns like which days see the most activity or whether mileage is trending up or down. If no data is available for the selected period, the chart will appear empty.
Trips Trend
A chart tracking trip counts per day. Useful for understanding workload distribution and capacity planning. Like the distance chart, this will appear empty if there are no trips in the selected period.
Real-Time Updates
The dashboard updates automatically using live data from your GPS trackers. You will see active and idle counts change as vehicles start and stop, distance counters increase as vehicles travel, and driver behavior scores adjust as new driving data comes in. You never need to refresh the page — the numbers on screen always reflect the current state of your fleet. If you would rather see this data spatially, switch to the Live Map where every vehicle appears on an interactive map.
Tips for Using the Dashboard
Check it first thing every morning. A quick glance at the Fleet Status card confirms all vehicles are accounted for and operating. If you normally have 20 active vehicles and only see 15, something needs investigating.
Monitor driver behavior trends. Switch between Today and Last week to compare driving scores. A declining score over the week could point to driver fatigue, route changes, or vehicles that need maintenance.
Act on fleet alerts promptly. The Fleet Alerts card surfaces connectivity issues like weak signal and offline trackers. Addressing these quickly ensures you maintain full visibility across your fleet.
Set up alerts for recurring problems. If the dashboard consistently shows high idle counts or poor braking scores, create automated alerts so you are notified without having to check manually.
Understanding the Data
Distance Accuracy
Distance is calculated from GPS coordinates as vehicles move. GPS-based measurement is typically accurate to within 2%, though accuracy can be affected by tall buildings in urban areas, tunnels, and poor weather conditions. For the most reliable readings, ensure your GPS trackers have clear sky visibility.
Active vs Idle vs Stopped
Understanding these three states helps you manage fleet efficiency:
- Active means the vehicle is moving at more than 2 km/h — it is on the road doing work
- Idle means the vehicle is stationary but the engine is running — this wastes fuel and increases wear. Common scenarios include waiting at loading docks, running air conditioning during breaks, or warming up engines
- Stopped means the engine is off and the vehicle is parked
Extended idling is one of the biggest sources of wasted fuel in fleet operations. If your dashboard consistently shows high idle counts, consider setting up idle-time alerts to notify drivers or managers when a vehicle has been idling too long.
What's Next?
- Live Map — See every vehicle on a real-time interactive map
- Reports — Generate detailed trip, mileage, and activity reports from your fleet data
- Alerts — Get notified automatically when fleet events need your attention
- Assets — Manage your vehicles, assign trackers, and organize your fleet
Frequently Asked Questions
How often does the dashboard refresh?
The dashboard receives live updates every few seconds via a persistent connection to the server. You never need to manually refresh the page — the data on screen always reflects the latest information from your trackers.
Can I customize which cards or charts appear?
The dashboard layout is standardized to ensure consistency across your team. However, you can switch between the Today and Last week time periods to change the data shown. For custom data views, use Reports where you can filter by specific vehicles, date ranges, and metrics.
Why does my total distance seem lower than expected?
Distance is calculated from GPS points, so short movements within parking lots or areas with poor GPS signal may not be fully captured. If a tracker goes offline temporarily (e.g., in an underground parking garage), the distance for that period is calculated when the tracker reconnects. Check individual vehicle trails on the Live Map to investigate.
Can I export dashboard data?
The dashboard itself does not have a direct export button, but you can generate equivalent data through Reports. The Daily Mileage report, Trip Report, and Activity Report all provide exportable versions of what you see on the dashboard, available in PDF, Excel, and JSON formats.
What does the driver behavior score measure?
The score is a composite rating from 0 to 100 based on four driving factors: smoothness, braking, idling, and eco-friendly driving. A higher score indicates safer and more efficient driving. The individual component bars on the Driver Behavior card help you identify which specific area needs improvement for your fleet.
Was this page helpful?