Reports
Generate comprehensive fleet reports and analytics
Reports
Generate detailed reports about your fleet's activity, mileage, driver behavior, and more. Reports help you analyze operations, reduce costs, and improve efficiency.
Report Categories at a Glance
Trips
Mileage
Driver
Sensors
Events
Location
Available Reports
Yipii IoT offers 19 different report types organized by category:
Trips & Movement
| Report | Description |
|---|---|
| Trip Report | Detailed breakdown of each trip: start/end times, locations, distance, duration, and average speed |
| Trail Report | Complete vehicle trail showing the exact path traveled with timestamps |
| Employee Trail | Movement history for drivers/employees |
| Start-Stop Trip | Condensed view of trip start and end points |
| Point Visits | Visits to specific points of interest |
Driver
For a detailed explanation of how driver scores and harsh events work, see Driver Scoring & Behavior.
| Report | Description |
|---|---|
| Driver Report | Activity summary for specific drivers |
| Driver Behavior | Speeding, harsh braking, rapid acceleration events |
| Driver Score | Safety and efficiency scoring for each driver |
Vehicle Data
| Report | Description |
|---|---|
| Fuel Report | Fuel consumption and fill-ups |
| Temperature Report | Temperature sensor readings over time |
| OBD Data | On-board diagnostics data (engine codes, metrics) |
Mileage
| Report | Description |
|---|---|
| Daily Mileage | Distance traveled per day for each vehicle |
| Weekly Mileage | Weekly distance summaries |
| Monthly Mileage | Monthly distance totals and trends |
| Mileage Comparison | Compare periods or year-over-year analysis |
Alerts
| Report | Description |
|---|---|
| Alerts Report | All triggered alerts during the period |
| Alarm Report | Alarm events and responses |
Beacons
| Report | Description |
|---|---|
| Beacon Environment | Bluetooth beacon detections |
| Portable Beacon | Portable asset beacon tracking |
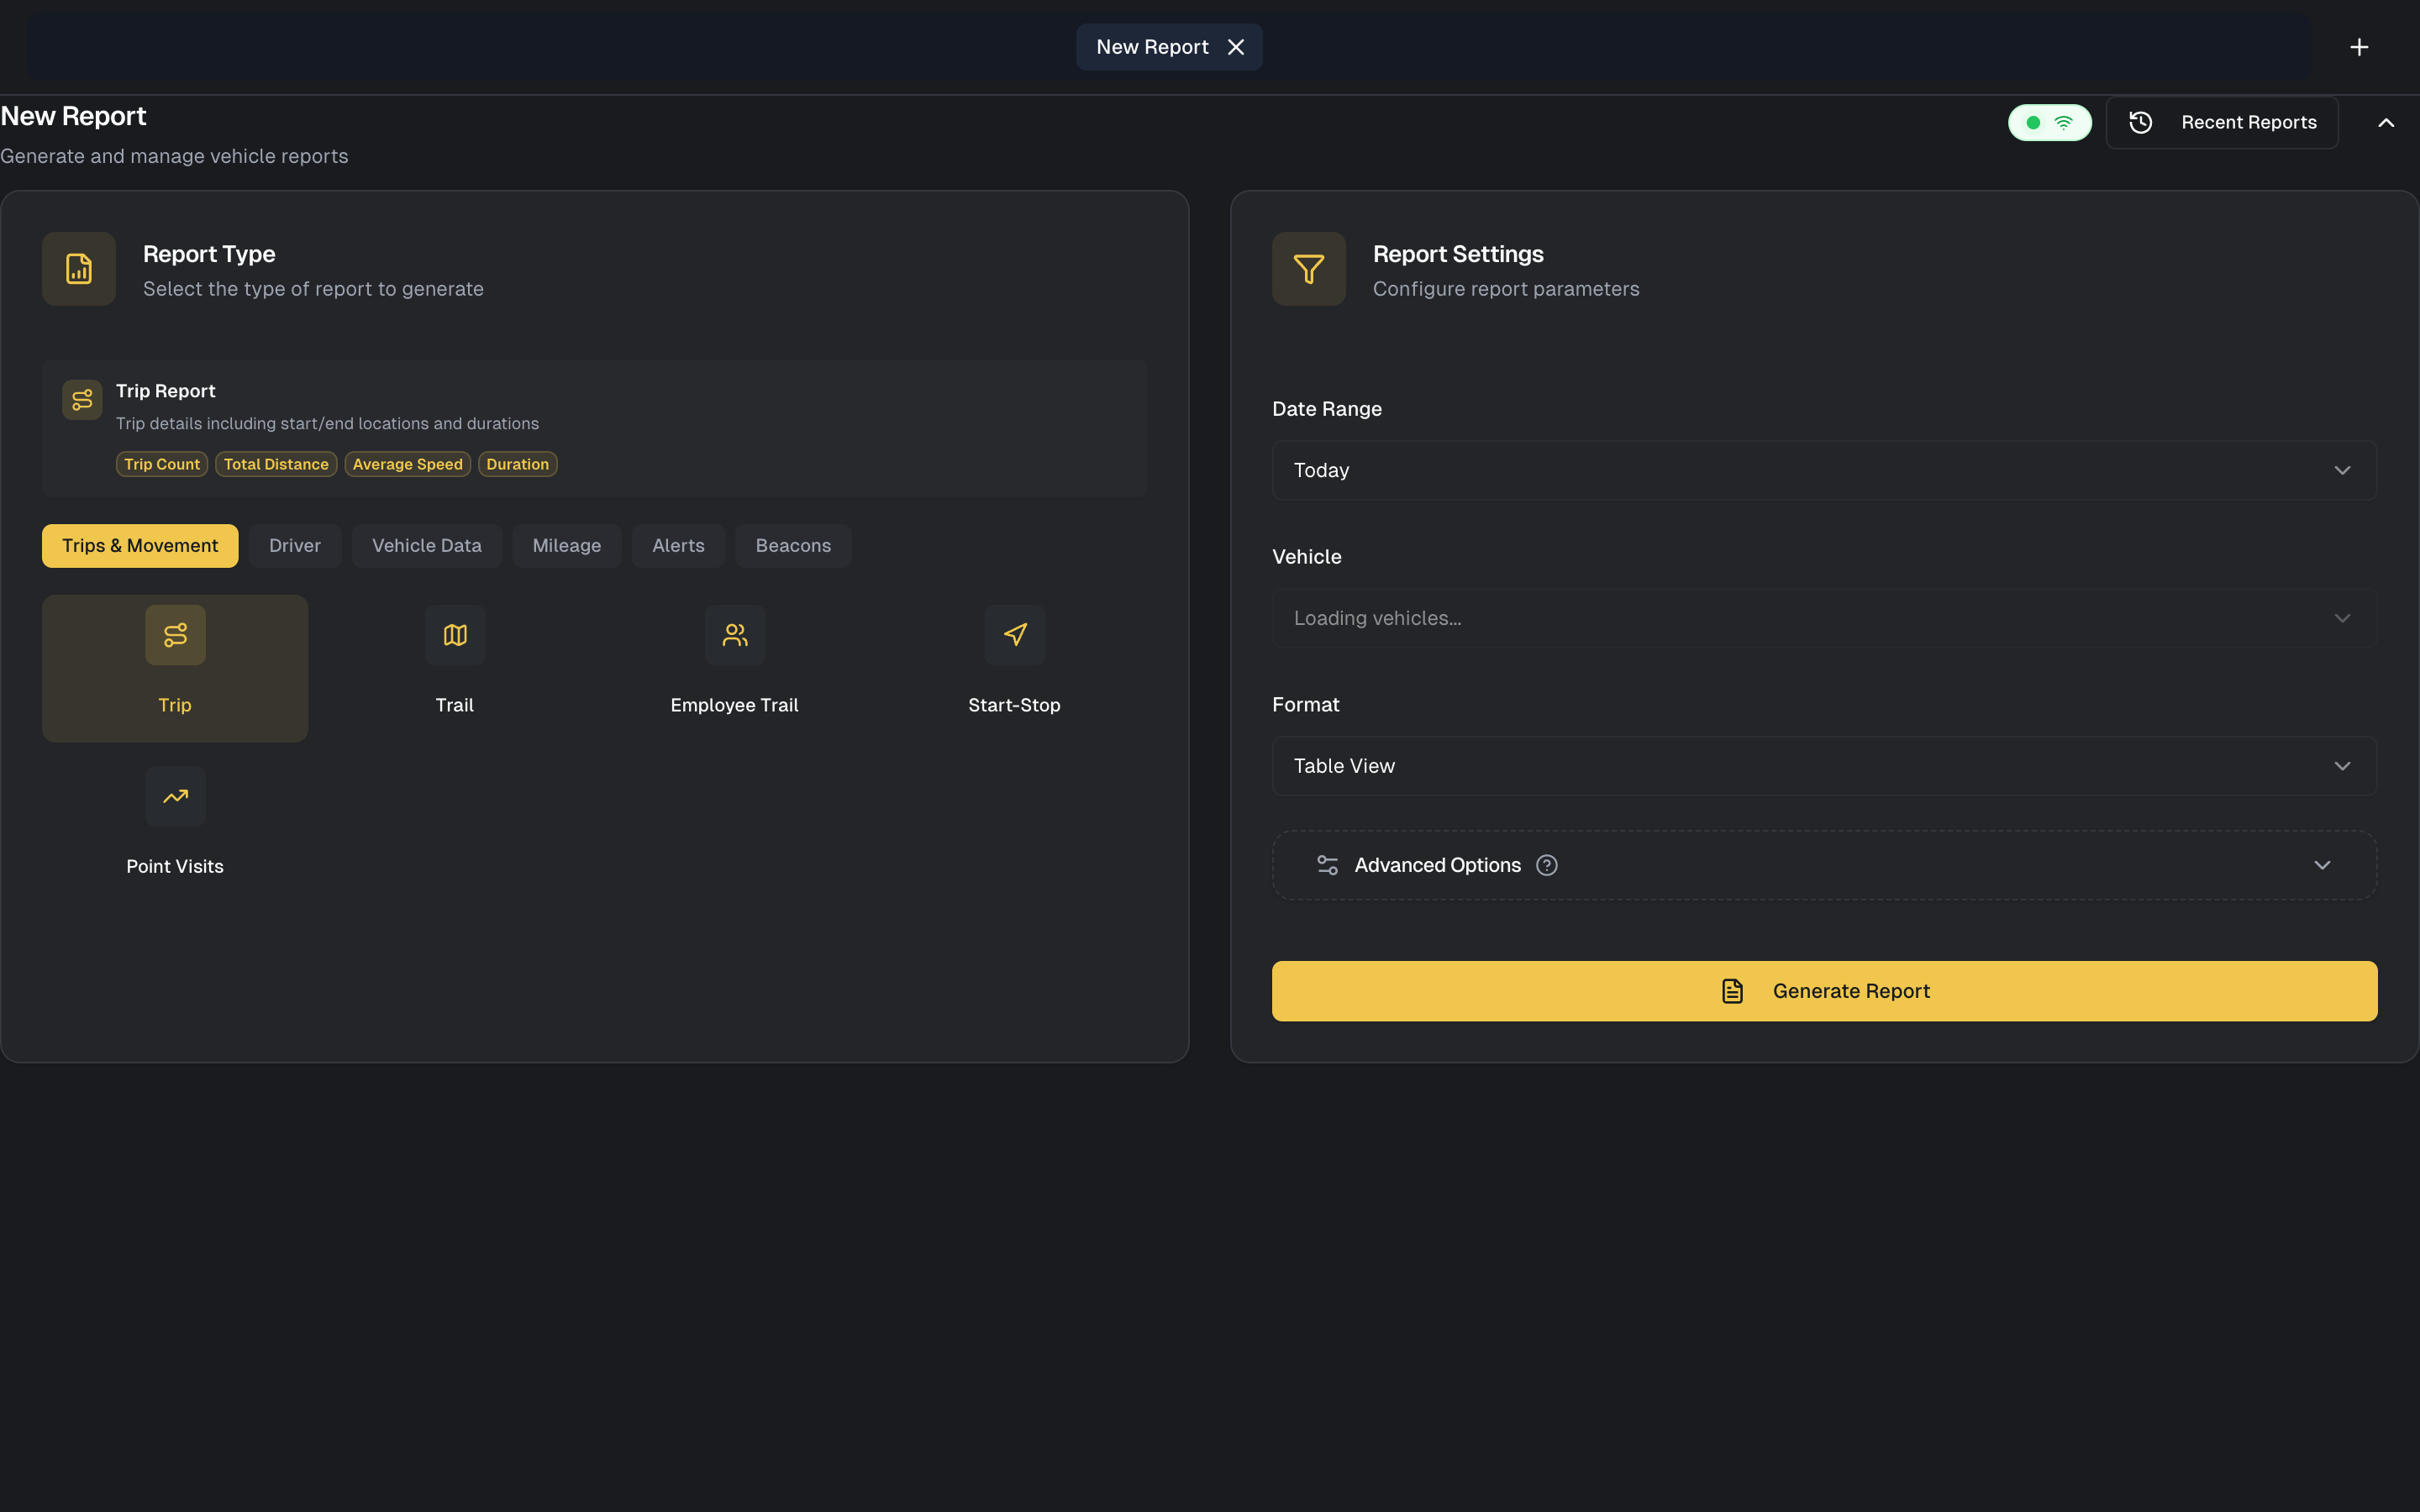
Generating a Report
Step 1: Select Report Type
- Go to Reports from the main navigation
- Choose the report type from the list or categories
Step 2: Configure Parameters
Date Range:
- Today
- Yesterday
- Last 7 days
- Last 30 days
- This month
- Last month
- Custom range (select start and end dates)
Assets:
- All assets
- Specific vehicles (multi-select)
- Asset groups
- Individual asset
Additional Filters (varies by report):
- Drivers
- Geofences
- Time of day
- Minimum distance
- Speed thresholds
Step 3: Generate
Click Generate Report. The report is processed and displayed.
Step 4: Export or Share
Download formats:
- PDF - Formatted document for printing or sharing
- Excel - Spreadsheet for further analysis
- HTML - Web-viewable format
- JSON - Machine-readable for integrations
Trip Report Details
The trip report is one of the most commonly used reports.
What's Included
For each trip, the report shows:
- Trip Number - Sequential identifier
- Start Time - When the trip began
- Start Location - Address or coordinates
- End Time - When the trip ended
- End Location - Address or coordinates
- Distance - Total distance traveled (km or miles)
- Duration - Total trip time
- Moving Time - Time actually moving
- Idle Time - Time stopped with engine running
- Average Speed - Mean speed during movement
- Maximum Speed - Highest speed recorded
- Fuel Used - If fuel sensor available
Trip Detection
A trip is detected when:
- Vehicle moves more than 100 meters
- Speed exceeds 5 km/h
A trip ends when:
- Vehicle stops for more than 3 minutes
- Ignition is turned off
Viewing Trip Details
Click on any trip to see:
- Route on the map
- Speed graph over time
- Stop points along the route
- Events during the trip (alerts, geofence crossings)
Mileage Reports
Track distance traveled across your fleet.
Daily Mileage
Shows kilometer/mile totals for each day:
- Vehicle-by-vehicle breakdown
- Daily totals
- Comparison to previous period
Use for:
- Billing customers per km
- Tracking usage patterns
- Identifying underutilized vehicles
Weekly/Monthly Mileage
Aggregate views for longer periods:
- Week-over-week trends
- Monthly summaries
- Seasonal patterns
Mileage Comparison
Compare mileage across:
- Period Comparison: This month vs. last month
- Year-over-Year: This month vs. same month last year
- Vehicle Comparison: Compare vehicles against each other
Driver Behavior Report
Analyze driving patterns and safety:
Metrics Tracked
- Speeding Events - How often and how much over the limit
- Harsh Braking - Sudden deceleration events
- Rapid Acceleration - Aggressive starts
- Harsh Cornering - Fast turns (if supported by tracker)
- Idle Time - Excessive idling
Driver Score
Each driver receives a score based on:
- Speeding (weighted heavily)
- Harsh events
- Idle time
- Overall safe driving
Scores help identify:
- Drivers needing training
- Top performers for recognition
- Trends over time
Fuel Report
Track fuel consumption and costs:
Data Sources
- Fuel sensor data - Real-time consumption from CAN bus
- Manual entries - Logged fill-ups
- Calculated estimates - Based on distance and vehicle efficiency
Report Contents
- Fill-up dates and amounts
- Cost per fill-up
- Consumption rate (L/100km or MPG)
- Anomalies (sudden consumption changes)
Fuel Efficiency Analysis
Identify:
- Most efficient vehicles
- Drivers with high fuel consumption
- Routes that use more fuel
- Impact of driving style on economy
Temperature Report
For vehicles with temperature sensors:
What's Tracked
- Continuous temperature readings
- Time above/below thresholds
- Temperature at key points (loading, delivery)
Cold Chain Compliance
Use temperature reports for:
- Regulatory compliance documentation
- Quality assurance records
- Incident investigation
- Customer proof of proper handling
Scheduled Reports
Automate report generation and delivery:
Setting Up a Schedule
- Generate a report with desired parameters
- Click Schedule This Report
- Configure:
- Frequency: Daily, Weekly, Monthly
- Day/Time: When to generate
- Recipients: Email addresses
- Format: PDF, Excel, or both
- Click Save Schedule
Managing Schedules
View and edit schedules in Reports > Scheduled:
- Pause/resume schedules
- Change recipients
- Modify parameters
- Delete schedules
Common Schedules
- Daily Activity: Every morning at 7 AM
- Weekly Mileage: Every Monday for the previous week
- Monthly Summary: First of month for previous month
Report Filters
Refine reports with filters:
Filter Types
| Filter | Use For |
|---|---|
| Date Range | Time period to analyze |
| Assets | Specific vehicles or groups |
| Drivers | Filter by assigned driver |
| Geofences | Events at specific locations |
| Minimum Distance | Exclude short trips |
| Speed Threshold | Filter by speed events |
Filter Operators
For advanced filtering:
- Equals: Exact match
- Contains: Partial match
- Greater Than: Above value
- Less Than: Below value
- Between: Range of values
Understanding Report Data
Distance Accuracy
GPS-calculated distance is typically accurate to within 2%. Factors affecting accuracy:
- Urban areas with tall buildings
- Tunnels and parking garages
- Weather conditions
- GPS signal quality
Time Zones
All reports use your account's configured time zone. If operating across time zones, this affects how trips are grouped by day.
Data Gaps
If a tracker goes offline:
- Trips during offline period show as single segment
- Distance is calculated when data resumes
- Duration may include offline time
Report Tips
Large Date Ranges
For reports spanning 30+ days:
- Processing takes longer
- Consider breaking into smaller periods
- Use summary reports (monthly mileage) for long-term analysis
Multiple Vehicles
When including many vehicles:
- File sizes are larger
- Use asset groups to organize
- Consider summary vs. detailed reports
Export for Analysis
Export to Excel when you need to:
- Create custom calculations
- Build pivot tables
- Combine with external data
- Create custom visualizations
Sharing Reports
- PDF: Best for management and customers
- Excel: Best for finance and analysis
- JSON: Best for system integration
- Email: Send scheduled reports automatically
Recent Reports
Your last 10 generated reports are saved for quick access. Go to Reports, click Recent Reports, and re-download or regenerate any previous report with the same parameters — no need to reconfigure filters each time.
What's Next?
- Dashboard — View real-time fleet summaries and key metrics without generating a full report
- Alerts — Configure the event-based notifications that feed into alert and behavior reports
- Assets — Manage the vehicles and equipment that appear in your reports
- Geofencing — Set up the geofences used in visit and point-visit reports
- Billing — Review your plan to understand report scheduling and export limits
Was this page helpful?