Driver Scoring & Management
Fleet-wide driver scoring, timesheets, communication, and driver management tools
Driver Scoring & Management
Yipii IoT continuously monitors driving behavior and generates scores that help you understand how safely and efficiently your fleet operates. The Driver Management page — accessible from the navigation menu under Drivers or via the top tab bar — brings together performance scoring, timesheets, communication, and driver administration in one place.
The page is organized into four tabs: Performance, Timesheets, Communication, and Manage Drivers.
Performance Tab
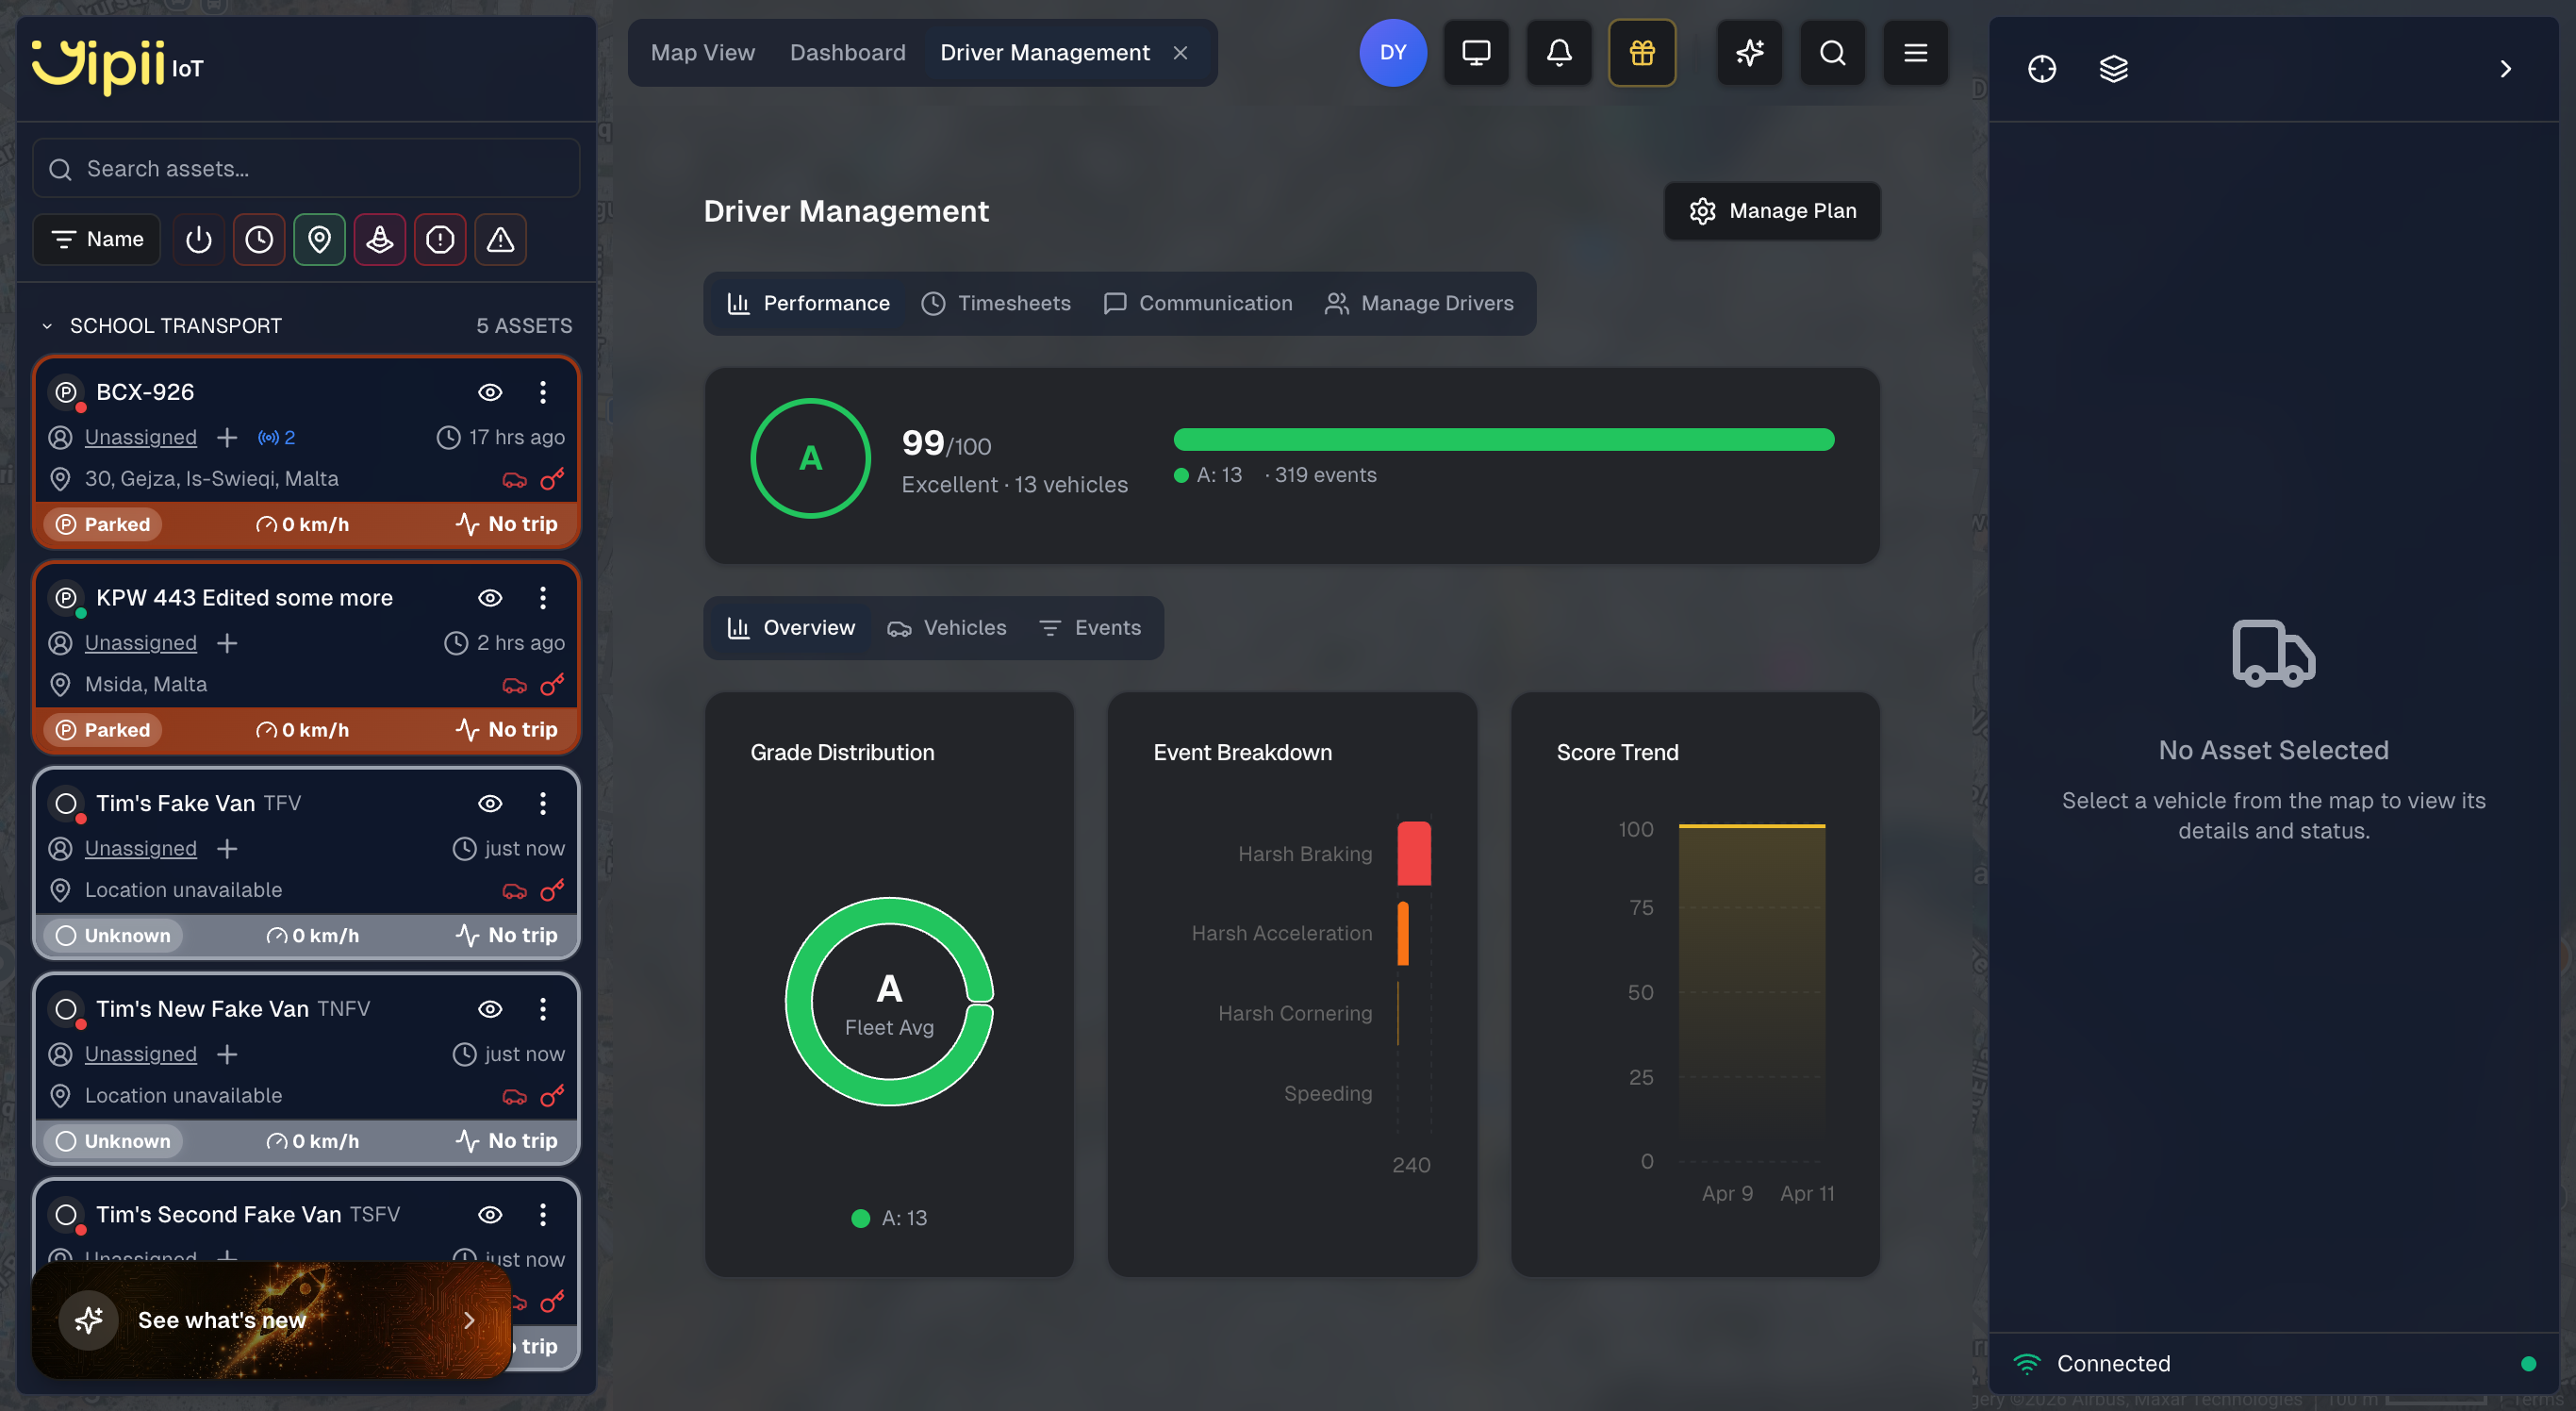
The Performance tab replaces the previous single-view scoring page and gives you a complete picture of fleet driving quality. At the top you see the overall fleet score (for example, A 99/100 Excellent) alongside the total vehicle count and event count. Grade breakdown badges summarize how many vehicles fall into each letter grade.
Below the summary, three sub-tabs let you drill into the data:
Overview
- Grade Distribution — A donut chart showing how many vehicles sit in each grade band (A through F).
- Event Breakdown — A bar chart comparing the volume of Harsh Braking, Harsh Acceleration, Harsh Cornering, and Speeding events across your fleet.
- Score Trend — A line chart tracking your fleet's average score over time so you can spot improvements or regressions.
Vehicles
A per-vehicle scoring breakdown with letter grades and numeric scores for every tracked vehicle. Use this view to identify which vehicles (and their assigned drivers) need coaching.
Events
A filterable, paginated list of individual harsh driving events — each one timestamped, geolocated, and categorized by type. Click any event to see it on the map.
Timesheets Tab
Driver Add-On
Timesheets require the Driver add-on. Click Manage Plan in the Driver Management page to upgrade.
The Timesheets tab provides clock-in and clock-out tracking for your drivers with GPS-verified time entries. Fleet managers can see who is currently on shift, review shift durations, and audit time entry history.
Communication Tab
Driver Add-On
Communication features require the Driver add-on. Click Manage Plan in the Driver Management page to upgrade.
Fleet managers can communicate with drivers through two channels:
Announcements
Broadcast messages to your entire fleet. When you send an announcement:
- All drivers receive it instantly in-app via real-time WebSocket
- Drivers with push notifications enabled also get a push notification on their device
- Announcements appear in the driver's Announcements tab
To create an announcement: go to Drivers > Communication > Announcements > New Announcement.
Direct Messages
Send private 1-on-1 messages to individual drivers:
- Messages are delivered in real-time via WebSocket
- Conversation history is preserved with read receipts
- Fleet managers see all conversations in a unified inbox
- Click any conversation to open the message thread in a slide-out panel
To start a conversation: go to Drivers > Communication > Messages > Message Driver.
Manage Drivers Tab
Driver Add-On
The Manage Drivers tab requires the Driver add-on. Click Manage Plan in the Driver Management page to upgrade.
Create and manage driver profiles, assign drivers to vehicles, and control app access:
- Create driver profiles with contact details and license information.
- Assign drivers to vehicles so scores and events are attributed to the correct person.
- Enable or disable app access for individual drivers without deleting their profile.
Score Bands
Your driver score is categorized into five bands on a 0 to 100 scale:
| Score | Grade | What It Means |
|---|---|---|
| 90 - 100 | Excellent | Drives very smoothly. Passengers would barely notice maneuvers. |
| 75 - 89 | Good | Drives well most of the time with only occasional sharp maneuvers. |
| 60 - 74 | Fair | Room for improvement. May be braking hard or accelerating sharply more often than ideal. |
| 40 - 59 | Poor | Driving is noticeably rough. Frequent harsh events detected. |
| 0 - 39 | Critical | Significant safety concerns that need immediate attention. |
| Grade | Range | Meaning |
|---|---|---|
| Excellent | 85 - 100 | Consistently smooth, safe driving |
| Good | 75 - 84 | Solid driving with occasional events |
| Fair | 65 - 74 | Room for improvement — coach recommended |
| Poor | 55 - 64 | Frequent harsh events — needs attention |
| Critical | 0 - 54 | Significant safety concern |
Example: A score of 85 means the driver operates smoothly most of the time with occasional sharp maneuvers — like getting a B+ on a driving report card.
Composite Driver Score
The headline driver score shown on asset cards and reports is a weighted average of five components:
Acceleration (30%)
Measures how smoothly you speed up. Think of it as: if you had a cup of coffee on the dashboard, would it spill when you accelerate?
What triggers a penalty:
- Acceleration harder than 2.5 m/s² (~0.26g)
- The harder the acceleration, the bigger the penalty
Tips for improvement:
- Take 5-8 seconds to reach your desired speed after a stop
- Ease onto the accelerator gradually
Braking (30%)
Measures how smoothly you slow down. Could a standing passenger stay on their feet?
What triggers a penalty:
- Deceleration harder than 2.5 m/s² (~0.26g)
- Sudden, late braking events have the most impact
Tips for improvement:
- Anticipate traffic and ease off the accelerator early
- Leave following distance so you can brake gradually
Cornering (25%)
Measures how smoothly you take turns. This is especially relevant on roundabouts — taking them at a moderate, steady speed scores better than rushing through.
What triggers a penalty:
- Course change greater than 30 degrees at speeds above 30 km/h
- Lateral force exceeding 0.6g
Tips for improvement:
- Reduce speed before entering a roundabout or corner, not during it
- Take turns at a moderate, controlled pace
Eco Driving (5%)
Measures fuel-efficient driving behavior. Aggressive driving can waste 10-40% more fuel.
The eco score is calculated from:
- Acceleration smoothness — 45% (the biggest controllable factor in fuel waste)
- Braking patterns — 30% (frequent harsh braking implies poor traffic anticipation)
- Speed consistency — 25% (steady speed improves fuel economy)
If your vehicle provides OBD eco data, that value is used directly instead of the GPS-based calculation.
Speed Pattern (10%)
Measures how consistently you maintain speed on the road. Constant speed changes — speeding up then slowing down repeatedly — lower this score. Cruise-control-like steadiness scores highest.
What triggers a penalty:
- Large deviations from your average speed
- Erratic speed fluctuations
- Readings below 5 km/h are excluded (idle/stopped traffic is not penalized)
March 2026 Recalibration
As of March 2026, we recalibrated the scoring weights and thresholds based on real-world fleet data. Acceleration and Braking now carry 30% each (up from 25%), while Eco Driving is reduced to 5% (down from 15%). The harsh event threshold dropped from 3.0 m/s² to 2.5 m/s². Fleet average scores are expected to settle around 65-75 (previously ~89) as the system catches more marginal events. This makes scores more meaningful for identifying drivers who need coaching.
Harsh Events
The system detects four types of individual driving events:
Harsh Acceleration
You pressed the accelerator hard enough that your body pushed back into the seat. Think of when a traffic light turns green and someone floors it.
- Threshold: 2.5 m/s² (0.26g)
- Cooldown: Minimum 3 seconds between events
- Recorded: Acceleration value, location, speed, timestamp
Harsh Braking
You braked hard enough that your body lurched forward. Like when someone stops suddenly because they almost missed a red light.
- Threshold: 2.5 m/s² deceleration (0.26g)
- Cooldown: Minimum 3 seconds between events
- Recorded: Deceleration value, location, speed, timestamp
Harsh Cornering
You turned sharply at speed. Picture taking a roundabout at 50 km/h instead of slowing to 30 km/h first.
- Threshold: Lateral force above 0.6g AND speed above 30 km/h
- Recorded: Lateral g-force, location, speed, timestamp
Speeding
You exceeded the speed limit by more than 10%.
- Urban roads (50 km/h): Alert triggers at 55 km/h
- Highways (120 km/h): Alert triggers at 132 km/h
- Recorded: Speed, duration, location, timestamp
Traffic & Congestion
Your vehicle also reports traffic conditions based on real-time speed data.
Traffic Flow Levels
| Traffic Level | Average Speed | What It Feels Like |
|---|---|---|
| Free Flow | Above 40 km/h | Open road, moving freely |
| Moderate | 27 - 40 km/h | Steady traffic, some slowing |
| Heavy | 17 - 27 km/h | Slow moving traffic |
| Congested | Below 17 km/h | Stop-and-go or near standstill |
Speed Consistency Score
This score (10-100) measures how consistently speed is maintained. Despite appearing as "road quality" in some views, it measures driving flow consistency, not road surface quality.
- High score (75+) — Smooth, consistent speed
- Low score (below 40) — Frequent stop-and-go conditions
Vehicle Health Monitoring
The GPS tracker monitors its own health every 60 seconds:
Normal operation. All parameters within optimal range.
No action needed.
Acceptable but not optimal. One or more parameters slightly out of ideal range.
Mention at next service.
Degraded operation. GPS accuracy may be reduced or electrical irregularity detected.
Schedule a check soon.
Immediate attention required. Battery may be very low or electrical fault present.
Inspect as soon as possible.
What Is Checked
| Parameter | Good Range | What It Means |
|---|---|---|
| Power Voltage | 9V - 32V | Vehicle battery and alternator health |
| Voltage Variation | Below 3V | Electrical system stability |
| Satellite Count | 8 or more | GPS positioning accuracy |
Power Stability
The system flags power as unstable when:
- Average voltage is outside the 9V-32V range
- Voltage fluctuation exceeds 3V
Typical readings:
- Car engine running: 13.5-14.5V
- Car engine off: 12.0-12.8V
- Heavy vehicle (24V): 24-28V
Tips to Improve Your Score
- Anticipate traffic. Look ahead and ease off the accelerator early rather than braking hard at the last moment.
- Accelerate gently. Take 5-8 seconds to reach your desired speed after a stop.
- Slow before turns. Reduce speed before entering a roundabout or corner, not during it.
- Maintain steady speed. Pick a speed and hold it. Avoid the cycle of speeding up then braking repeatedly.
- Leave following distance. More space between you and the car ahead means less reactive braking.
- Plan routes. Avoiding congested areas and peak times reduces the need for harsh maneuvers.
These habits not only improve your score but also reduce fuel costs by up to 20% and significantly decrease accident risk.
Free vs. Driver Add-On
Driver Management is available in two tiers:
Free (Included with all plans)
All Yipii IoT accounts get the full Performance tab at no extra cost:
- Fleet scores — Letter grades (A-F) and numeric scores (0-100) for every tracked vehicle
- Score breakdown — Acceleration, braking, cornering, eco, and speed pattern component scores
- Grade distribution — Donut chart showing how your fleet is spread across grades
- Event breakdown — Bar chart of harsh braking, acceleration, cornering, and speeding events
- Score trends — Line chart tracking fleet performance over time
- Vehicles view — Per-vehicle scoring breakdown
- Events view — Filtered and paginated event log
- Reports — Driver behavior and driver score reports
Driver Add-On (Paid)
Upgrade to unlock the remaining tabs and advanced features:
- Timesheets — Clock-in/clock-out tracking with GPS-verified time entries
- Communication — Fleet-wide announcements and direct messaging between fleet managers and drivers
- Manage Drivers — Create driver profiles, assign drivers to vehicles, and control app access
- Gamification & Rewards — Points, badges, streaks, weekly challenges, and a competitive leaderboard with a reward catalog managed by fleet managers
- Driver Portal — Dedicated mobile-first dashboard for each driver to view their own scores, badges, and history
How to Upgrade
- Navigate to Drivers in the navigation menu (or the Drivers tab in the top tab bar)
- Click Manage Plan in the Driver Management page
- Start a 7-day free trial via Stripe
- After the trial, the add-on is billed monthly as part of your subscription
Using Scores in Reports
Yipii IoT includes scoring data in several report types:
- Driver Behavior Report — Speeding, harsh braking, acceleration events, and driving score per driver
- Driver Score Report — Overall score, safety metrics, efficiency score, and improvement areas
- Trip Reports — Include driving events along the route
Reports can be scheduled daily, weekly, or monthly and delivered automatically by email.
Frequently Asked Questions
How often is my score updated?
Scores are calculated in real time. The system processes data every 30 seconds and pushes updated scores immediately. You always see the latest score on the dashboard.
What is a good score?
A score of 75 or above is considered "Good." Most professional fleet drivers consistently score between 75 and 90. Scores above 90 are exceptional.
Why did my score drop suddenly?
A single harsh event can reduce your score significantly for that period. The score recovers as you drive smoothly. Check the Driver Behavior report to see which specific events caused the drop.
Does traffic affect my score?
Traffic conditions do not directly affect your driver score. The scoring system only penalizes actions within your control — how hard you brake, accelerate, and turn. Being in heavy traffic does not lower your score, but the stop-and-go may lead to more harsh events if you are not anticipating traffic flow.
How accurate are the thresholds?
Our acceleration and braking thresholds (2.5 m/s²) are on the sensitive side compared to industry norms, which means we detect more events than some competitors. This is intentional for fleet safety monitoring. The cornering threshold (0.6g) is more lenient to accommodate frequent roundabouts and narrow turns.
Can I see where events happened?
Yes. Every harsh event includes GPS coordinates. In the reports and on the map, you can see exactly where each event occurred with colored pins:
- Red: Harsh braking
- Orange: Harsh acceleration
- Blue: Harsh cornering
- Purple: Speeding
What's Next?
- Reports — Generate driver behavior, driver score, and trip reports using scoring data
- Alerts — Configure speed, harsh braking, and other driving event alerts
- Assets — View driver scores on individual asset detail pages
- Beacons & Tags — Set up iButtons or Bluetooth beacons for driver identification
Was this page helpful?