Diagnostics
Monitor OBD-II Diagnostic Trouble Codes (DTCs) and device connection health across your fleet
Diagnostics
The Diagnostics page centralizes every OBD-II Diagnostic Trouble Code (DTC) reported across your fleet, alongside real-time device health and connection status from the AVL tracking system. DTCs are standardized fault codes emitted by a vehicle's onboard computer when it detects a problem. Yipii Mobility collects them from IoT trackers, OBD scans, and manual entries so you can spot issues early, prioritize repairs, and track resolution end-to-end.
Accessing Diagnostics
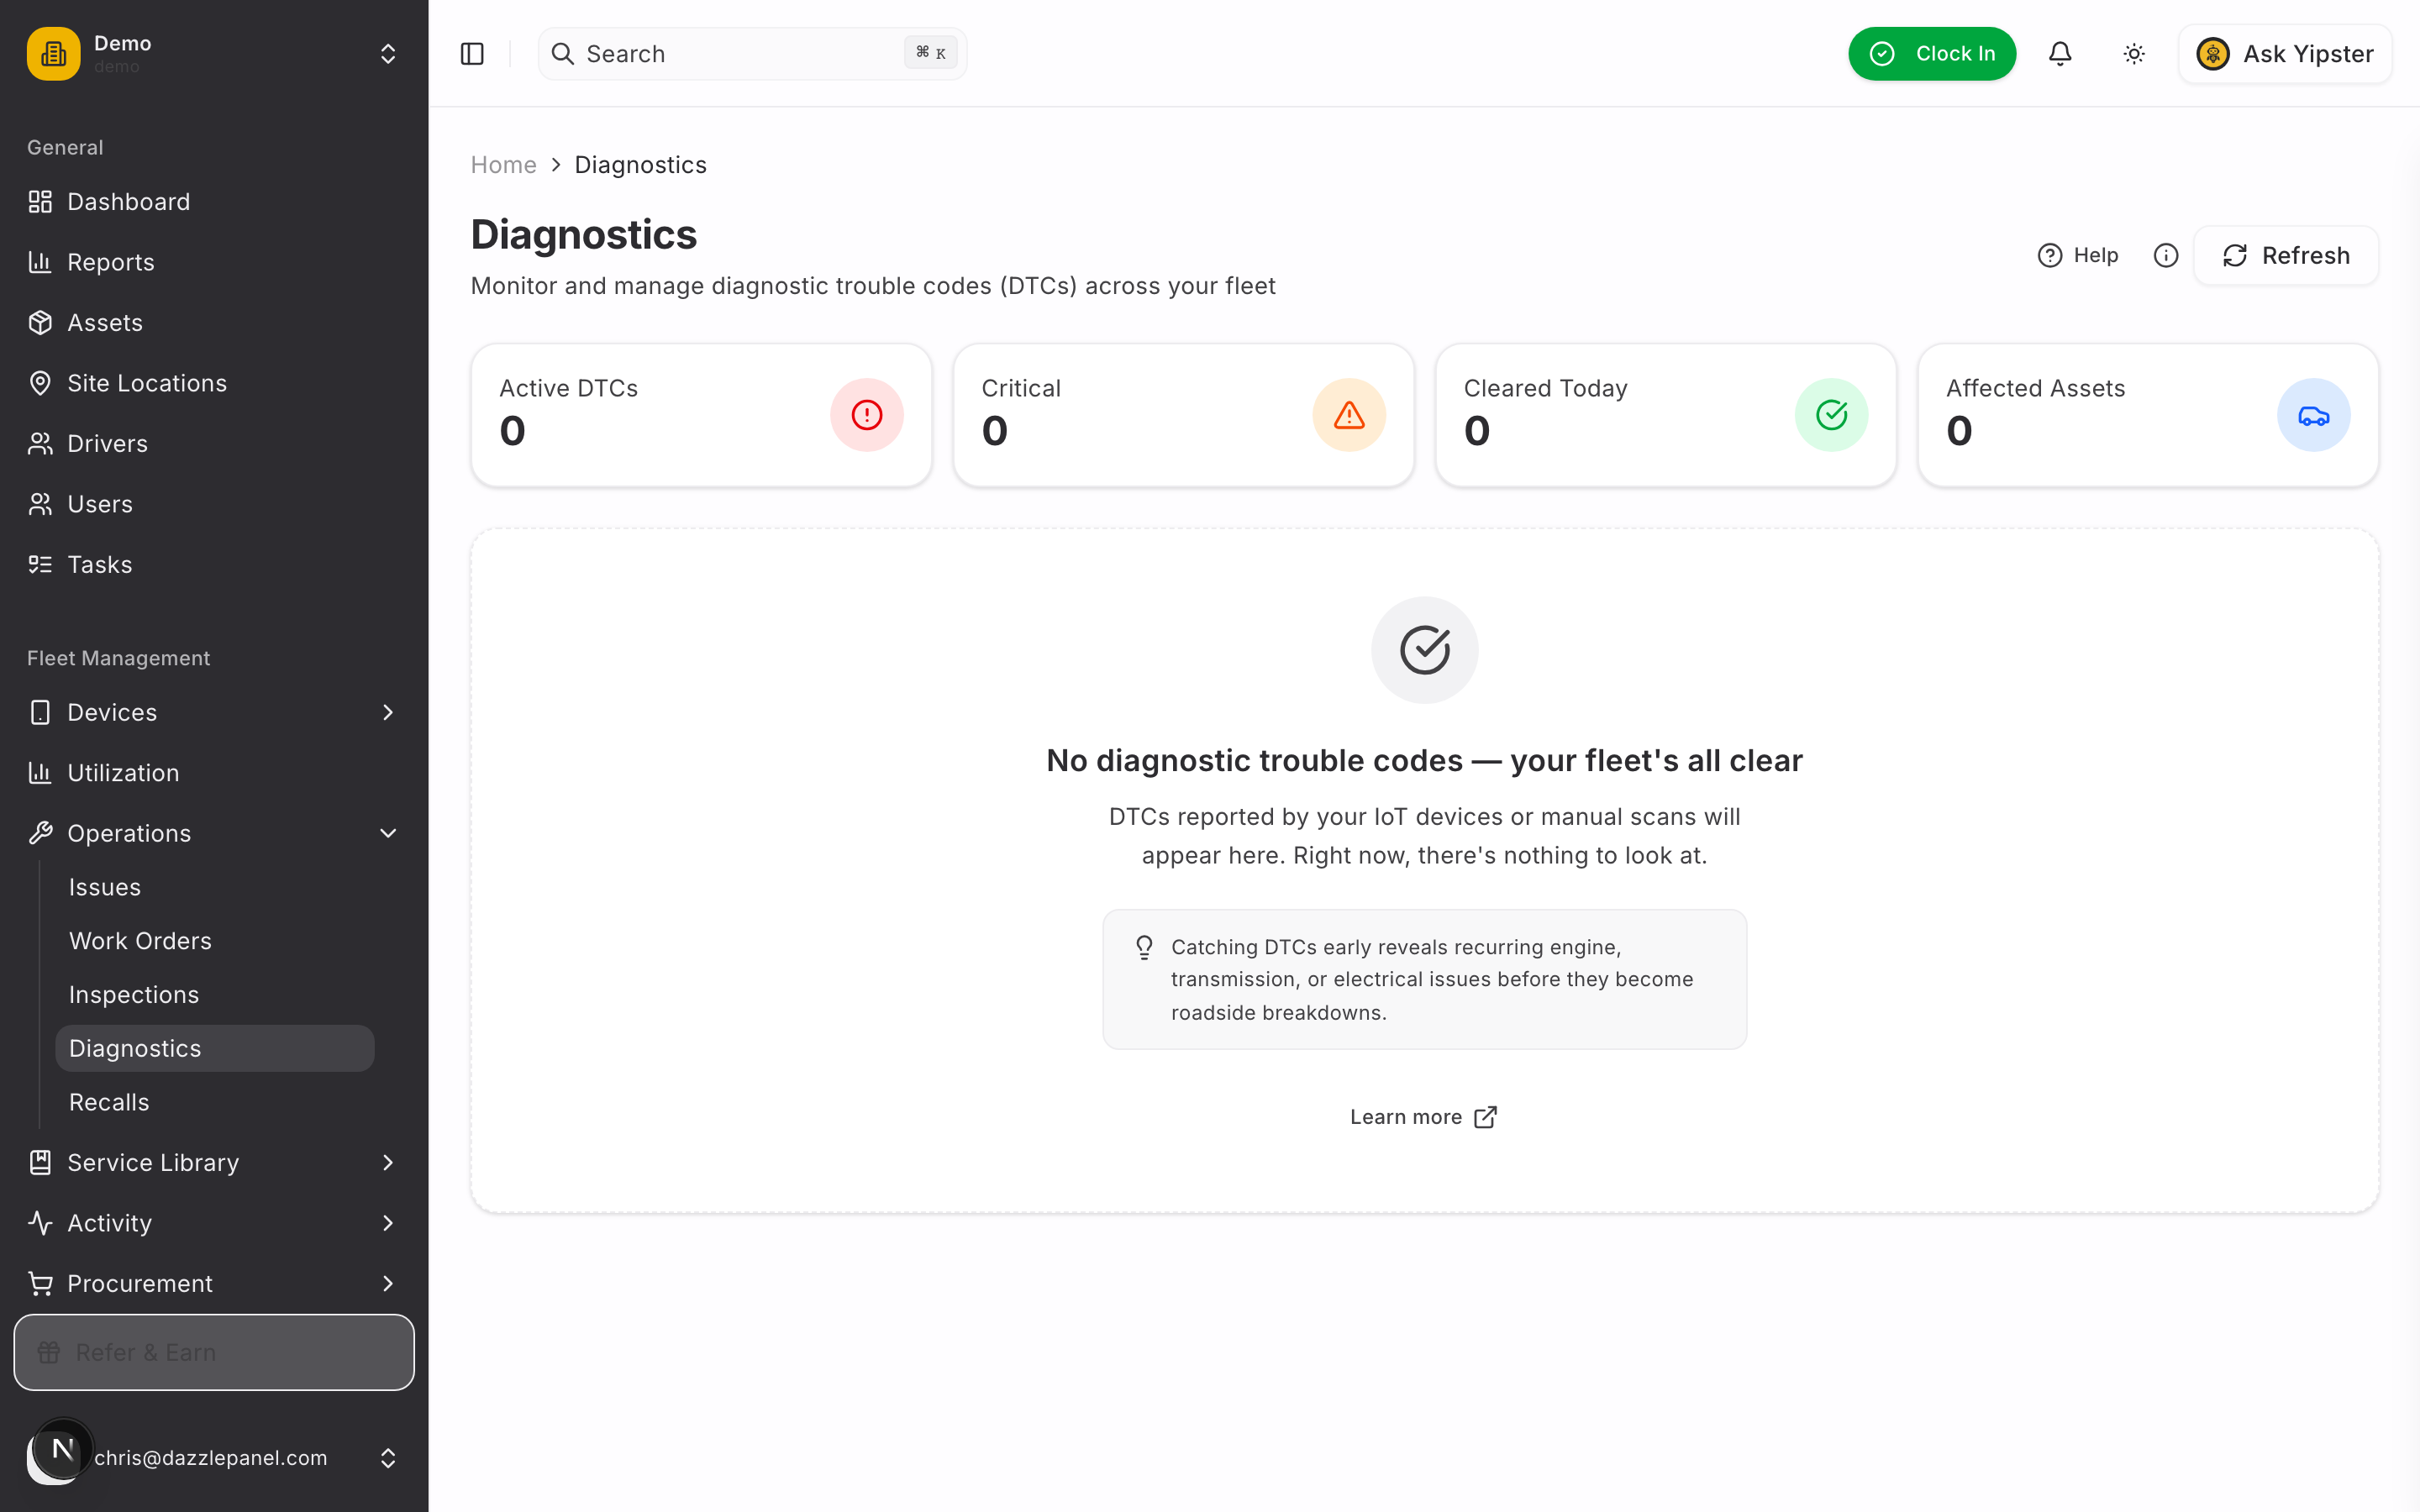
Navigate to Fleet Management > Operations > Diagnostics in the sidebar. The page opens to a searchable, filterable list of every DTC recorded across your fleet, with summary cards above the table.
List View
The DTC table displays the following columns:
| Column | Description |
|---|---|
| DTC Code | Standardized fault code (e.g., P0301). Click to open the detail page. |
| System | Which vehicle system the code belongs to — Powertrain, Body, Chassis, or Network |
| Description | Short description pulled from the DTC code database |
| Severity | Critical, High, Medium, Low, or Info |
| Status | Active, Acknowledged, In Repair, or Cleared |
| First Detected | Timestamp of the first time this code was seen on the asset |
| Last Detected | Timestamp of the most recent occurrence |
| Occurrences | How many times the code has been detected on the asset |
| Asset | Vehicle or equipment that reported the code (click to open) |
Filters
Narrow results using:
- Severity — Critical, High, Medium, Low, Info
- Status — Active, Acknowledged, In Repair, Cleared
- System — Powertrain, Body, Chassis, Network
- Asset — Single-asset view
Understanding DTCs
Diagnostic trouble codes follow a standardized format. The first letter identifies the vehicle system:
| Prefix | System | Covers |
|---|---|---|
| P | Powertrain | Engine, transmission, fuel, and emissions |
| B | Body | Airbags, seat belts, lighting, climate control |
| C | Chassis | ABS, traction control, steering |
| U | Network | Communication between vehicle control modules |
Severity Levels
Each DTC is assigned a severity level to help you prioritize:
- Critical — Immediate attention required. The vehicle may not be safe to operate.
- High — Significant problem that could affect performance or safety. Schedule repair promptly.
- Medium — Moderate concern that should be investigated soon.
- Low — Minor issue that does not affect drivability. Address during routine maintenance.
- Info — Informational only. No immediate action required.
Status Lifecycle
A DTC moves through the following states as your team works the issue:
- Active — Newly detected and not yet reviewed.
- Acknowledged — A team member has reviewed the DTC and accepted it is known. Repair is not yet scheduled.
- In Repair — A work order has been created for this DTC. The repair is in progress.
- Cleared — The problem has been resolved. The cleared date and user are recorded.
DTC Detail Page
Click any DTC code in the list to open its detail page. The page presents enriched information pulled from a built-in DTC code database plus the detection history for that code on that specific asset.
Header and Inline Actions
The header shows the DTC code, short description, and badges for the current status and severity. From the header you can run:
- Acknowledge — Mark the DTC as reviewed (available when status is Active).
- Create Work Order — Open the work order form pre-filled with the asset, DTC code, and description.
- Clear DTC — Resolve the DTC (available when status is Active, Acknowledged, or In Repair).
Detail Cards
The detail page is organized into cards:
- Description — Short and detailed description of the code, pulled from the DTC code database.
- Recommended Action — Suggested diagnostic steps or repair procedures. If no recommendation is available, the card advises consulting a qualified mechanic.
- Possible Causes — A bulleted list of common root causes (faulty sensor, wiring issue, failed component, etc.).
- Symptoms — Observable signs that may accompany the fault (rough idle, reduced power, warning light, etc.).
- Detection Details — Contextual data captured at the time of detection:
- When the DTC was first seen
- Latest freeze frame snapshot (engine RPM, speed, coolant temp, load, etc.)
- Odometer / mileage at detection
- Source (IoT, OBD Scan, or Manual)
- Occurrence History — Every time the code was detected on this asset, with clear/reactivate events interleaved. Linked work orders and team notes appear here as well.
Managing DTCs
Acknowledging a DTC
Acknowledging signals to the team that someone has reviewed the issue and is aware of it. Useful when you need time to schedule a repair.
- Open the row menu or the detail page.
- Click Acknowledge.
- Status changes from Active to Acknowledged and records who acknowledged it and when.
Creating a Work Order from a DTC
One-click work order creation:
- Open the row menu or the detail page and click Create Work Order.
- The work order form opens pre-filled with the asset, DTC code, and a diagnostic work-type.
- Fill in any remaining details (assigned technician, due date, parts, labor) and save.
- The DTC status moves to In Repair and the work order is linked to the DTC for traceability.
Clearing a DTC
Once the repair is verified, clear the DTC to mark it resolved.
- Open the row menu or the detail page and click Clear DTC.
- Status moves to Cleared; the cleared date and user are recorded.
- If the same code reappears later, a new occurrence is added to the occurrence history and the DTC reactivates.
Clear DTCs only after the repair has been verified, not just when the code has been reset on the vehicle. Resetting without fixing the underlying cause simply delays the code reappearing.
Device Health and Connection Diagnostics
Beyond DTC codes, the Diagnostics section surfaces real-time device health information from the AVL tracking system. These indicators help you distinguish a vehicle problem from a tracker problem.
AVL Verdict
A traffic-light indicator at the top of the Device Health panel summarizes connection health as assessed by the AVL server:
- Green — The device is actively connected and transmitting (e.g., "ACTIVELY MOVING"). No action needed.
- Yellow — The device has an intermittent issue that may affect data freshness. Worth monitoring.
- Red — The device has a significant connection problem (e.g., "FROZEN", data lost). Investigate promptly.
Data Sources
Three independent pipelines are compared for freshness. When they disagree, the disagreement itself often points at the problem.
| Source | What It Shows |
|---|---|
| WebSocket | Age of the last live position event received by your browser — confirms real-time flow |
| AVL REST | Age of the latest data on the AVL server, plus TCP connection status and frozen flag |
| DB Row | Age of the most recent database record, plus server lag (device timestamp to DB write) |
Each source shows a color-coded age: green for fresh (under 1 minute), amber for moderately stale (1–10 minutes), red for stale (over 10 minutes).
Diagnostic Findings
The system runs automated checks and reports findings with severity levels:
- Error (red) — Critical issues: device frozen, TCP disconnected for an extended period, AVL data loss.
- Warning (amber) — Notable concerns: stale packet data (over 5 minutes), AVL verdict yellow/red, multiple idle timeouts.
- Info (blue) — Informational notes: connection metrics, recent freeze history.
- OK (green) — Confirmation that a check passed.
Findings include a title, detail text, and where applicable a suggested action.
Connection Diagnostics (Admin View)
Administrators see an extended panel of AVL connection metrics, useful for troubleshooting tracker issues:
| Metric | Meaning |
|---|---|
| Session Started | When the current tracking session began |
| First Seen / Last Activity | Timestamps for the first and most recent data from the device |
| Last Packet (seconds ago) | How recently the AVL server received a data packet |
| Connect Count | Number of TCP connections established |
| Packets Decoded | Total data packets successfully processed |
| Idle Timeouts | How many times the connection went idle |
| Data Lost | Packets dropped or lost on the wire (highlighted when non-zero) |
| Shadowed Packets | Duplicate or out-of-order packets detected |
| Stuck Close | Connections that failed to close cleanly |
Permissions
| Role | Permissions |
|---|---|
| Admin | View all DTCs, acknowledge, clear, create work orders, log manual entries, full connection diagnostics |
| Fleet Manager | View all DTCs, acknowledge, clear, create work orders |
| Mechanic | View DTCs for assigned assets, acknowledge, clear, create work orders |
| Inspector | View DTCs for inspection-related assets |
| Driver | View DTCs for assigned assets (read-only) |
| Office Staff / Reports Only | View only |
Best Practices
- Review active DTCs daily to catch new issues early before they escalate to breakdowns.
- Acknowledge DTCs promptly so your team knows someone is on it.
- Read the detail page first — possible causes and recommended actions save diagnostic time.
- Check the AVL verdict when a vehicle seems unresponsive. A red verdict with a "FROZEN" label points at the tracker, not the vehicle.
- Compare data sources when troubleshooting. If WebSocket is fresh but AVL REST is stale, the issue is server-side rather than on the device.
- Create work orders for High and Critical DTCs rather than just clearing them — it preserves a proper repair history.
- Track recurring codes via the occurrence count. A code that keeps coming back indicates the root cause was not fully fixed.
- Clear only after verification — never before.
Related Features
- Work Orders — Create repair tasks from DTCs with one click
- Assets — View DTC history per asset
- Service Schedules — Preventive maintenance reduces DTC occurrences
- Inspections — Catch issues before they trigger DTCs