Dashboard Overview
Understand the Yipii Mobility dashboard, its layout, stats cards, quick actions, and AI assistant
Dashboard Overview
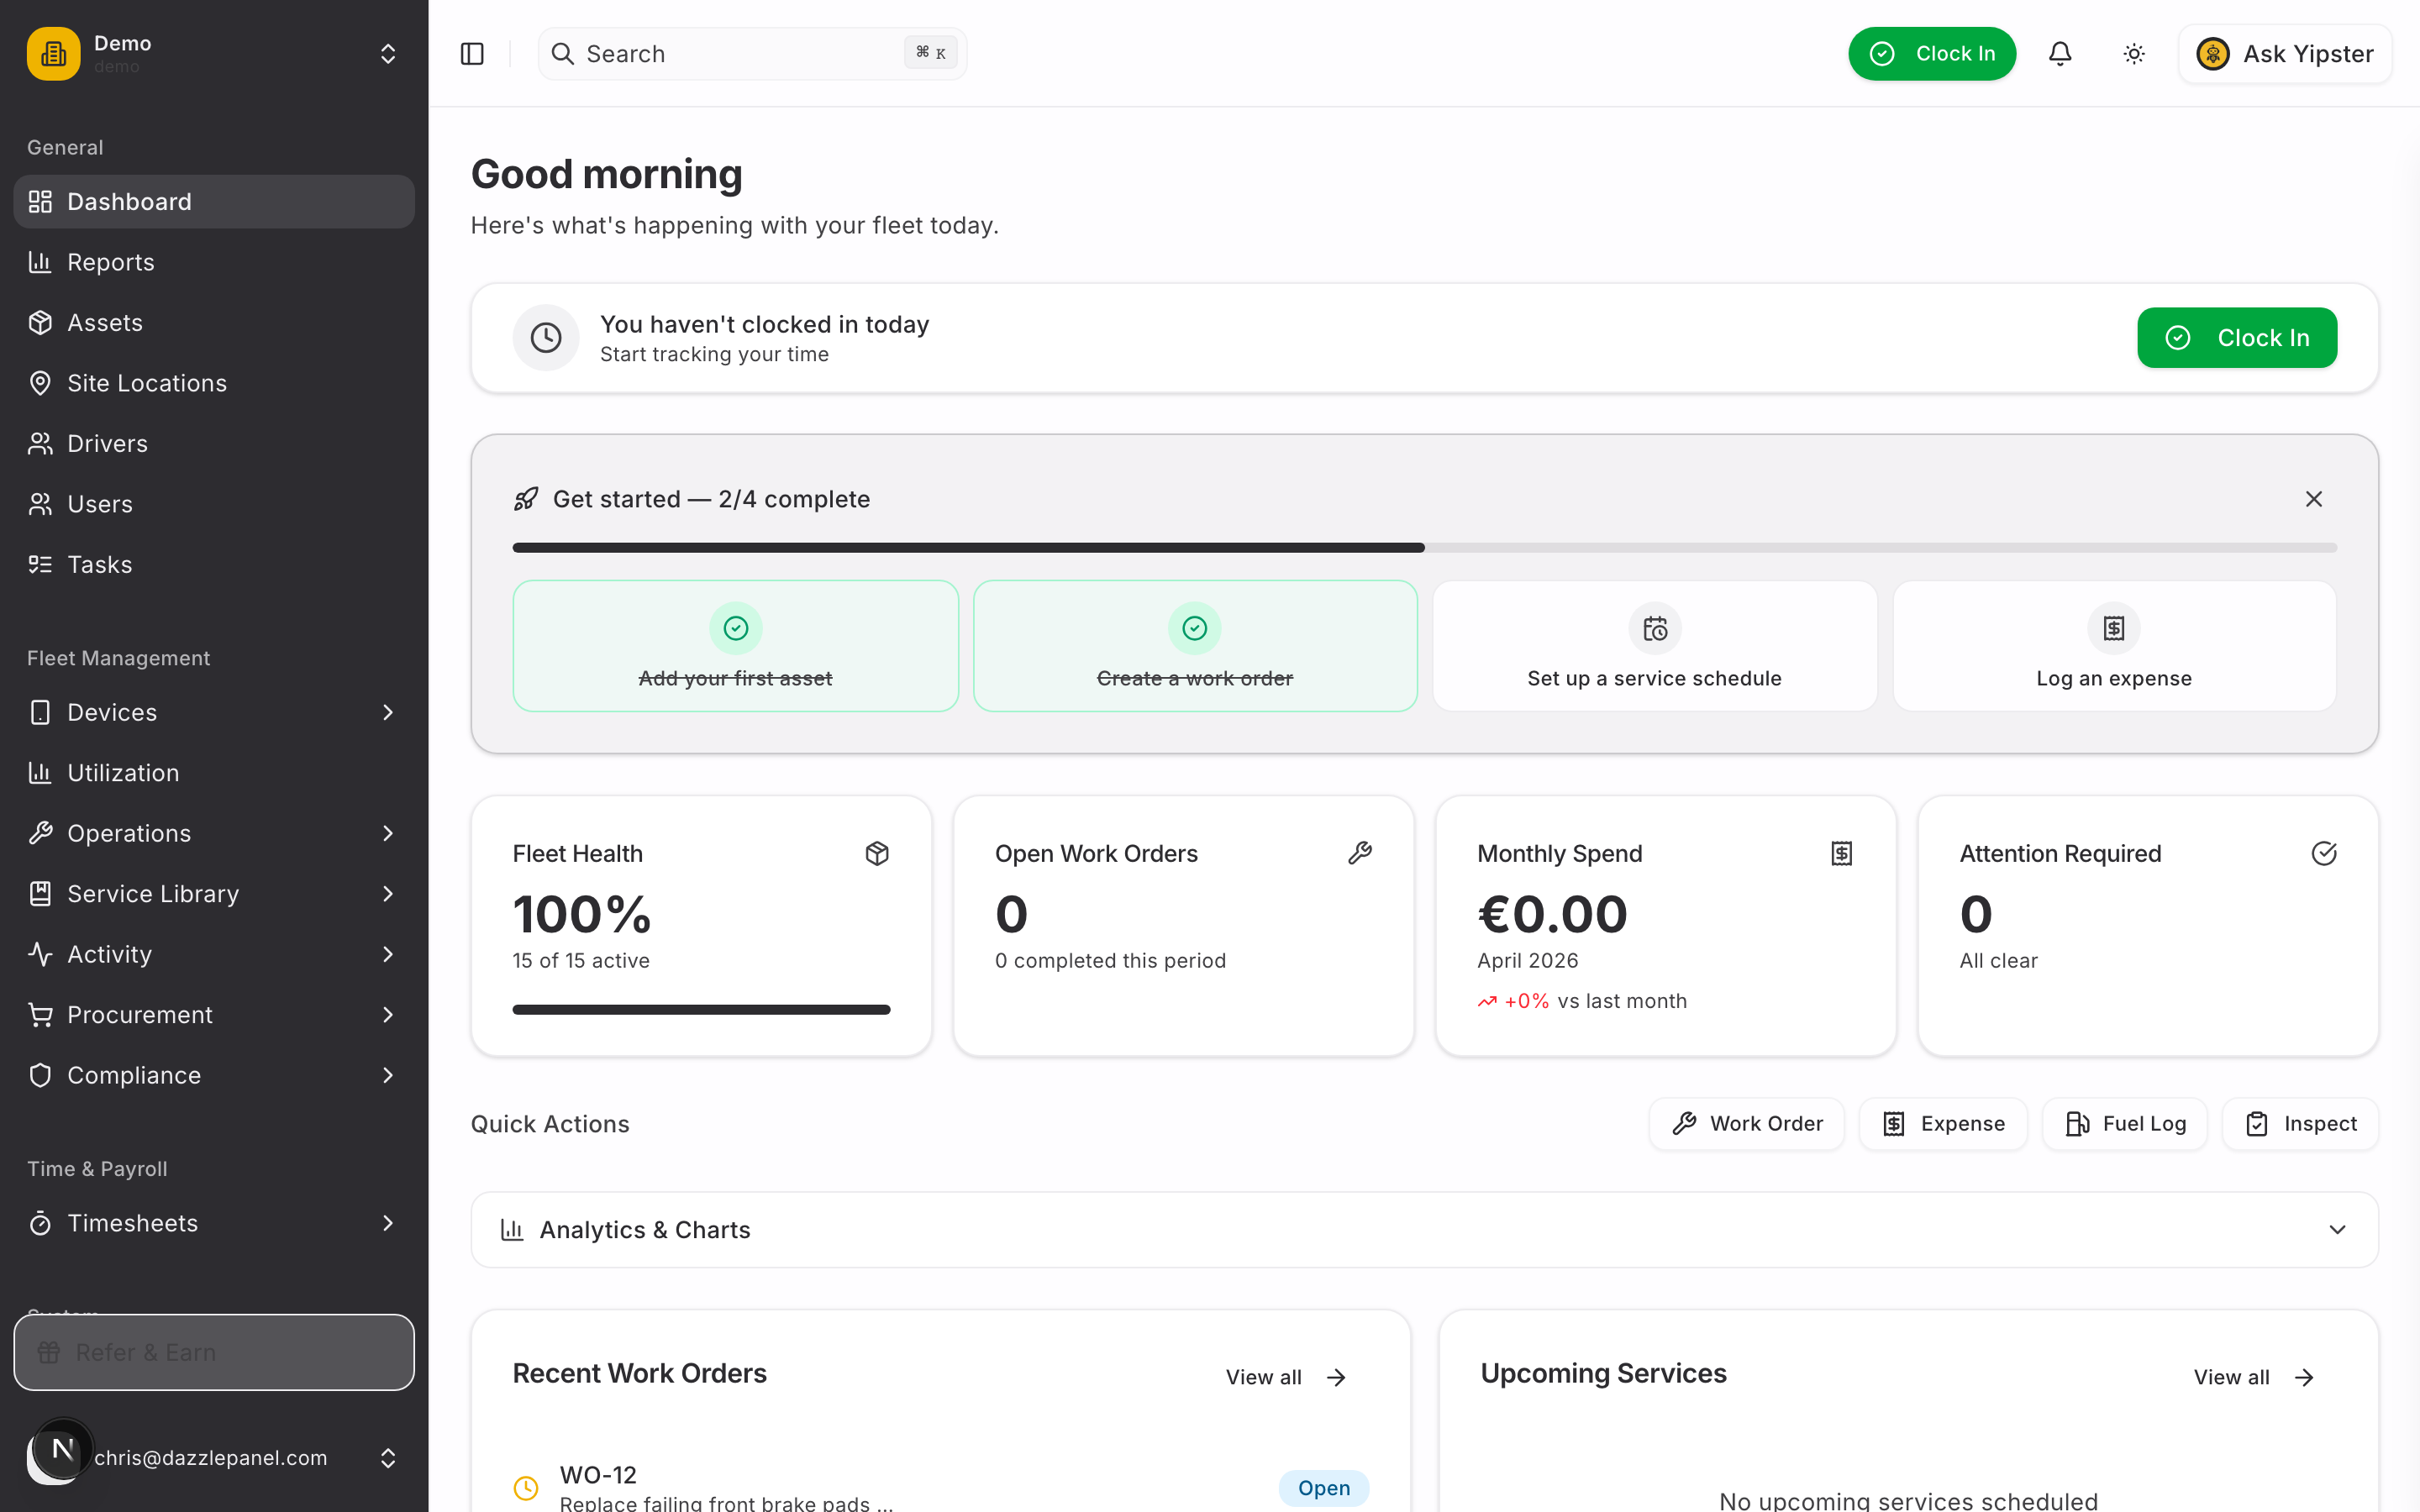
The Dashboard is your command center for monitoring fleet health at a glance. It greets you with a time-aware welcome message, surfaces items that need attention, and provides one-click access to common tasks -- all on a single scrollable page.
Accessing the Dashboard
Click Dashboard in the sidebar under the General section to open the main dashboard. You can also navigate directly to /dashboard. When you log in, you land here by default.
Role-Based Dashboards
The dashboard adapts to your assigned role. Yipii Mobility supports seven fixed roles, and each sees a tailored set of cards, lists, and quick actions:
| Role | Dashboard Focus |
|---|---|
| Admin | Full dashboard with all stats, analytics, fleet-wide visibility, and system actions |
| Fleet Manager | Fleet-wide visibility across assets, maintenance, work orders, and reports |
| Office Staff | Operational overview with work orders, expenses, scheduling, and upcoming services |
| Reports Only | Read-only analytics, charts, and report links |
| Mechanic | Assigned work orders, service schedules, and maintenance tasks |
| Inspector | Inspection templates, scheduled inspections, and recent inspection results |
| Driver | Assigned work orders, time tracking, and fuel logs |
Items you do not have permission to access are hidden automatically.
Dashboard Layout
The dashboard is a single scrollable page organized into the following sections from top to bottom.
Greeting
A time-aware greeting appears at the top of the page -- for example, "Good morning", "Good afternoon", or "Good evening" -- followed by the subtitle "Here's what's happening with your fleet today." The greeting provides a quick contextual anchor each time you visit the dashboard and updates based on your local time.
Clock In Banner
If you have not clocked in for the day, a prominent yellow banner appears below the greeting:
You haven't clocked in today -- Start tracking your time
Click the Clock In button on the right side of the banner to start your time tracking session. Once you clock in, the banner is replaced with your active session indicator showing elapsed time. This integration means you do not need to navigate to a separate time tracking page to start your day.
Stats Cards
Three summary cards sit below the clock-in banner and provide at-a-glance fleet metrics:
| Card | What It Shows | Links To |
|---|---|---|
| Fleet Health | Overall health indicator for your fleet, summarizing active assets, overdue services, open issues, and device connectivity into a single status (Good, Fair, Poor) with a percentage or count | Assets page, filtered to problem items |
| Open Work Orders | Count of currently open work orders with a subtitle showing how many were completed in the current period (e.g., "3 completed this period") | Work Orders page, filtered by pending status |
| Monthly Spend | Total expenses in EUR for the current month, with the month name displayed and a percentage change compared to the previous month (e.g., "+12% vs last month") | Expenses page |
Each card is clickable and navigates you to the corresponding feature page with the relevant filter applied.
Attention Required
A section with a count badge that highlights items needing your review -- such as overdue services, pending work order approvals, expiring documents or licenses, open recalls, and unresolved diagnostic trouble codes. Each item links directly to the record that needs attention.
When there are no outstanding items, the badge shows zero and the section displays an "All clear" message, giving you immediate confidence that nothing is being missed.
Quick Actions
A horizontal row of shortcut buttons lets you perform common tasks without navigating away from the dashboard:
| Button | Action |
|---|---|
| Work Order | Opens the quick-add dialog to create a new work order |
| Expense | Opens the quick-add dialog to log a new expense |
| Fuel Log | Opens the quick-add dialog to record a fuel entry |
| Inspect | Navigates to the Inspections page to start or schedule an inspection |
The Work Order, Expense, and Fuel Log buttons open inline quick-add dialogs so you can submit data without leaving the dashboard. The Inspect button navigates you to the full Inspections page.
Analytics and Charts
An expandable section that you can collapse or expand using the section header toggle (chevron icon). When expanded, it displays visual charts and graphs for deeper fleet analysis:
- Work Orders Trend -- A line or bar chart showing work order creation and completion over time.
- Monthly Costs -- A chart tracking maintenance and operational costs month by month.
- Expenses Breakdown -- A breakdown of expenses by category (parts, labor, fuel, vendor, etc.).
- Asset Utilization -- A summary of how effectively your fleet is being used, powered by IoT tracker data.
- Service Compliance -- A visual indicator of how well your fleet is keeping up with scheduled maintenance.
Collapsing this section keeps the dashboard compact for day-to-day use while still making the data available when you need it. Your preference is remembered across sessions.
Recent Work Orders
A list of the five most recently created work orders. Each entry shows:
- Work order ID (e.g., WO-142)
- Description or title
- Asset it relates to
- Status badge -- color-coded as green (completed), blue (in progress), or yellow (pending)
Click any work order to view its full detail page, or click View all to navigate to the complete Work Orders list.
Upcoming Services
A list of the next upcoming service schedules, sorted by due date. Each entry shows:
- Schedule name
- Schedule ID (e.g., SS-8)
- Asset the schedule applies to
- Due date with color-coded indicators:
- Red with "(Overdue)" label for past-due schedules
- Yellow for schedules due within the next 7 days
- Default color for schedules further out
Click View all to navigate to the full Service Schedules page.
Yipster AI Assistant Panel
The Yipster AI assistant is accessible from any page via the AI Assistant toggle in the header bar. Clicking the toggle opens a slide-in panel on the right side of the screen where you can ask questions about your fleet in natural language.
Suggested prompts to get started:
- "Show open work orders"
- "Which vehicles need service soon?"
- "Any overdue inspections?"
- "Show this month's expenses"
- "What's my fleet health status?"
- "Which assets haven't moved in 7 days?"
Yipster has access to your fleet data and can surface relevant information without requiring you to navigate to different pages. Answers include inline links to the referenced records. Close the panel at any time by clicking the toggle again or pressing Escape.