Fleet Utilization
Monitor asset utilization rates with visual gauges, configurable benchmarks, trend analysis, and optimization recommendations
Fleet Utilization
Fleet utilization measures how effectively each asset is being used. Use it to identify underutilized vehicles (wasted investment), overutilized vehicles (wearing out faster), and optimal performers -- then right-size your fleet accordingly.
Access the dashboard via the sidebar: Fleet Management > Utilization.
How Utilization Is Calculated
The primary metric is distance travelled per day versus a configured target:
Calculations draw from multiple data sources for accuracy:
| Source | Role |
|---|---|
| IoT tracker trips | Primary source -- distance, duration, trip count |
| Odometer readings | Backup / validation for distance travelled |
| Fuel log entries | Consumption and efficiency scoring |
| Engine hours | Heavy equipment usage (hours-based utilization) |
| Idle time | Stationary time with ignition on (efficiency score) |
Utilization is calculated daily, with rolling 7-day, 30-day, and 90-day windows available on the dashboard.
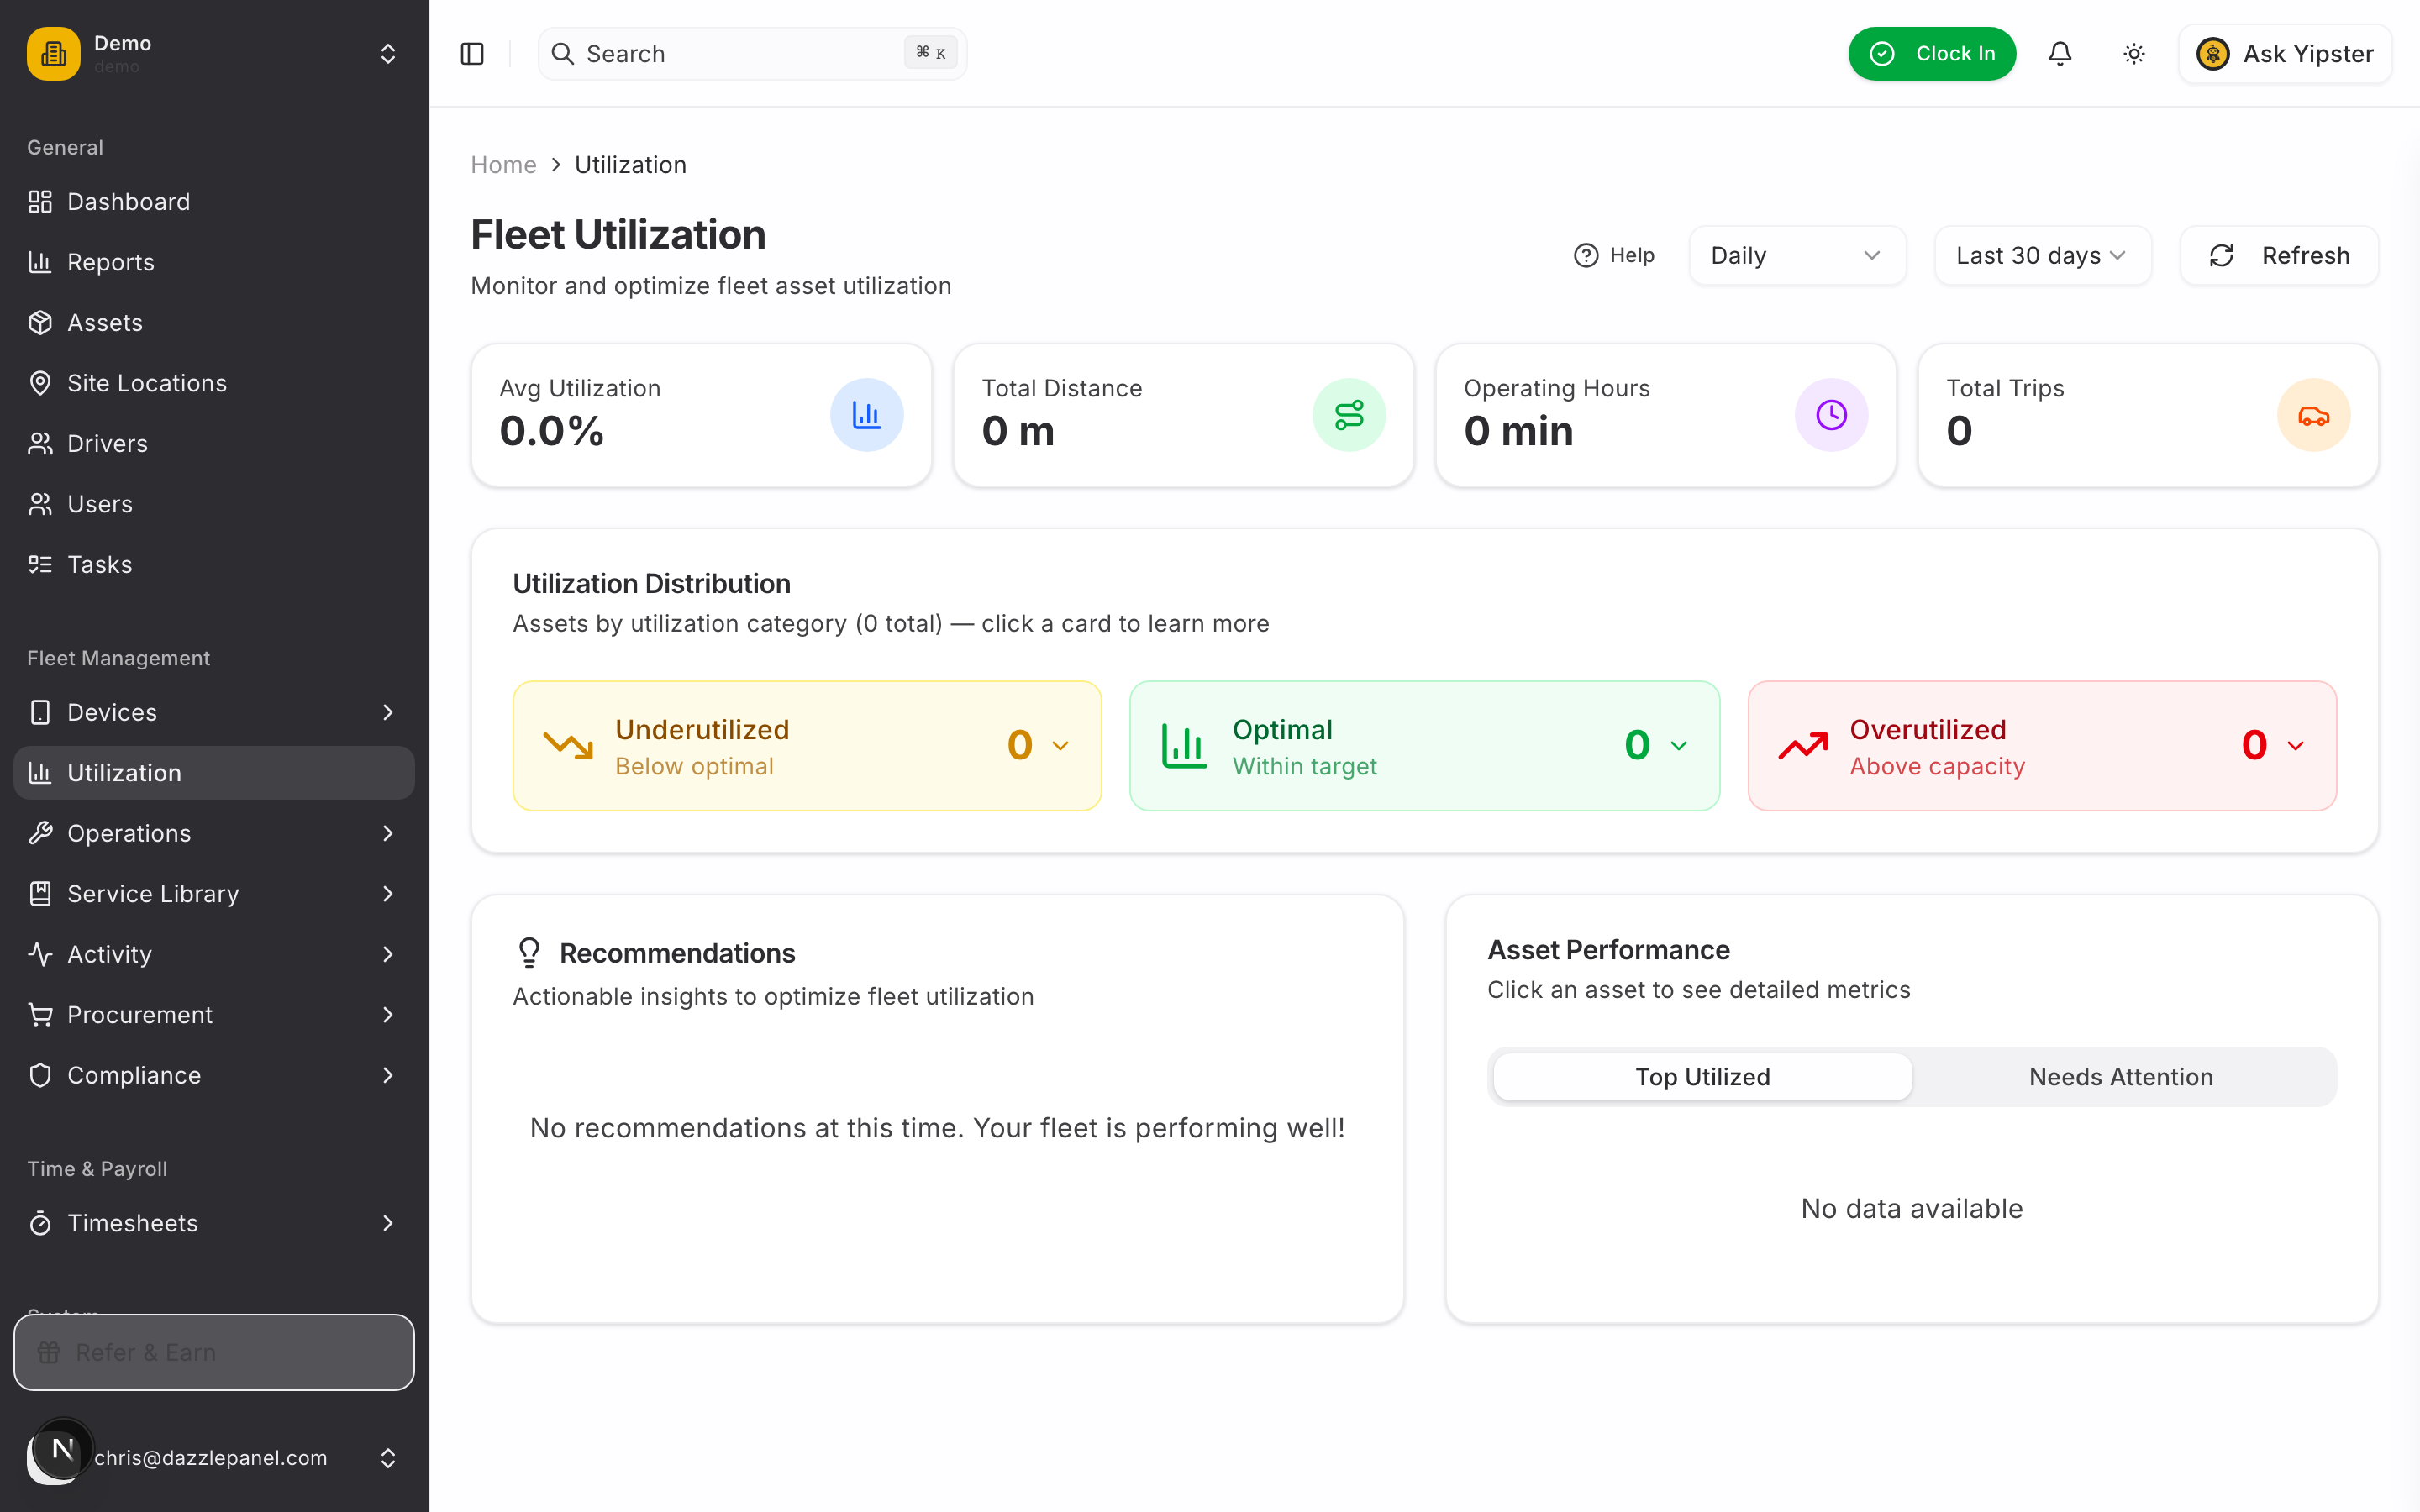
Dashboard Layout
Period Selection
The selector at the top of the page controls the time window for every card and recommendation on the page:
- Today -- Current day only
- This Week -- Current week (Monday-Sunday)
- This Month -- Current calendar month
- Custom Range -- Pick any start/end date
Fleet Summary Stats
Four cards give a fleet-wide snapshot:
| Card | What It Shows |
|---|---|
| Total Active Assets | Number of assets reporting activity in the selected period |
| Average Utilization | Fleet-wide average utilization percentage |
| Total Distance / Hours | Sum of kilometres (or miles) or engine hours across the fleet |
| Idle Asset Count | Assets at 0% utilization for the period |
Utilization Gauge (Per Asset)
Every asset card displays a horizontal gauge with a 0-120% scale and three colour zones:
| Zone | Colour | Meaning |
|---|---|---|
| Under threshold | Red | Underutilized -- asset is not being used enough |
| Optimal range | Green | Being used within the target band |
| Over threshold | Amber | Overutilized -- at risk of accelerated wear |
A needle indicator marks the asset's current value on the scale. Hover over the info icon next to the gauge to see the calculation tooltip -- it shows the daily distance target, the threshold values, and a shortcut to Settings > Utilisation.
Asset Utilization Cards
Each asset has its own card showing:
- Asset name and type
- Utilization percentage
- Trend indicator (up/down arrow versus the previous period)
Click a card to expand it and reveal:
- Active hours (engine on, moving)
- Inactive hours (engine on, stationary)
- Distance travelled in the period
- Fuel consumption (if tracked)
- Trip count
- Average daily distance
- Benchmark / target used for comparison
Recommendations System
The Recommendations panel surfaces prioritised alerts with Low, Medium, or High severity. Recommendations are grouped by issue type so you can act on patterns, not just individual assets.
Severity Levels
| Severity | Example |
|---|---|
| High | "Asset BCX-926 significantly underutilized (15% of target) -- consider selling or reassigning" |
| Medium | "5 assets in School Transport group consistently below target -- review fleet size" |
| Low | "Asset MDC-215 slightly overutilized -- schedule extra maintenance" |
Issue Groups
Recommendations are clustered into:
- Underutilized assets -- individual assets below threshold
- Overutilized assets -- individual assets above threshold
- Asset type patterns -- an entire type underused across the fleet
- Group-level patterns -- a group (e.g. depot, region) performing poorly
Use Show more to expand the full list and Show less to collapse it.
Configurable Benchmarks
Benchmarks define what "underutilized" and "overutilized" mean for your fleet. Configure them from Settings > Utilisation.
Benchmark Fields
| Setting | Description |
|---|---|
| Benchmark Name | Label for the benchmark (e.g. "City Delivery Van") |
| Asset Type / Subtype | Which assets the benchmark applies to |
| Weekly Distance Target | Expected weekly distance (km or miles) |
| Underutilized Threshold | Below this percentage the asset is flagged as underutilized (e.g. 60%) |
| Overutilized Threshold | Above this percentage the asset is flagged as overutilized (e.g. 110%) |
Benchmark Cascade
The system matches each asset to the most specific benchmark available:
- Asset subtype benchmark (most specific)
- Asset type benchmark
- Default benchmark (fleet-wide fallback)
You can define multiple benchmarks per asset type to reflect different operational patterns -- for example, "Long haul truck" vs "Regional truck" both under the Truck type. The cascade picks the subtype-specific benchmark first.
Managing Benchmarks
From Settings > Utilisation you can Add, Edit, or Delete benchmarks. If no benchmarks exist, the dashboard prompts you to configure targets with a link to the settings page.
Per-Asset Utilization Tab
Every asset has its own Utilization tab. Navigate to Assets > select an asset > Utilization:
- Utilization gauge with needle indicator against the applicable benchmark
- Key metrics -- distance, operating hours, fuel (if tracked)
- Trend indicator versus the previous period
- Trend chart showing daily or weekly history
- Recommendation card if the asset is outside thresholds
Use this tab for a deep dive on a single asset when a fleet-wide recommendation points you at it.
Utilization Scheduling
Calculations run automatically on a recurring schedule:
| Cadence | What Runs |
|---|---|
| Daily | Overnight batch processes every asset's previous-day data |
| Weekly | Monday morning summary for the week just ended |
| Monthly | 1st of the month summary for the month just ended |
A Manual refresh button is available on the dashboard if you need fresh numbers immediately -- for example, after adjusting benchmarks.
Use Cases
Right-Sizing the Fleet
- Identify consistently underutilized assets for sale or reassignment
- Flag overutilized assets that signal you need additional units
- Balance workload across depots or teams
Maintenance Planning
- Overutilized assets need more frequent service -- use utilization to adjust schedules
- Feed actual usage (not calendar dates) into service intervals
- Prioritise inspections on the hardest-working assets
Cost Analysis
- Cost per km or per hour by asset
- ROI analysis for fleet investments
- Fuel efficiency by utilization band (optimal utilization is often the most fuel-efficient)
Export and Reporting
- Export utilization data as CSV for spreadsheet analysis
- Schedule weekly or monthly email reports to managers
- Include utilization charts in executive dashboards
Permissions
| Role | Access |
|---|---|
| Admin | Full access -- can configure benchmarks |
| Fleet Manager | Full access -- can configure benchmarks |
| Office Staff | View only |
| Reports Only | View only |
| Mechanic | View assets they service |
| Driver | View their assigned vehicles only |
Best Practices
- Configure benchmarks first -- recommendations are only useful once you have realistic targets
- Use asset-type-specific benchmarks -- "van" and "truck" have very different usage patterns; don't force them onto a single benchmark
- Review recommendations monthly as a standing agenda item in management meetings
- Adjust thresholds over time as fleet patterns change with seasons and contracts
- Combine with fuel and maintenance data for the full cost picture -- an underutilized asset is still burning insurance and depreciation
- Use the 90-day view for strategic fleet-sizing decisions and the 7-day view for operational adjustments
FAQ
What counts as "utilization" -- distance or hours?
By default, utilization is distance-based (km or miles per day versus target). For heavy equipment that doesn't travel far -- excavators, generators, forklifts -- use an hours-based benchmark instead. The benchmark type you configure determines which metric drives the gauge.
Why is my asset showing 0% utilization?
Common causes:
- The tracker is offline or not reporting
- The asset has no trips in the selected period
- The benchmark is misconfigured (e.g. target set to 0)
- The asset is parked for maintenance or seasonal storage
Check the asset detail page -- if trips exist but utilization is 0, review the benchmark assignment.
How do I set different targets for different seasons?
Utilization benchmarks are not time-sliced today. For seasonal fleets, edit the benchmark at the start of each season or use Custom Range on the dashboard to focus on the current operating window.
What's the minimum data needed for utilization tracking?
At minimum you need a tracker reporting trips or regular odometer entries, plus a benchmark assigned to the asset's type. Fuel and engine-hours data are optional enrichments.
Can I compare utilization across groups?
Yes -- the Recommendations panel surfaces group-level patterns automatically. For ad-hoc comparisons, export the CSV and pivot by group, or use the per-asset tab to drill into individual group members.
Related Links
- Managing Assets -- View individual asset details
- Service Schedules -- Adjust maintenance based on utilization
- Dashboard Overview -- Monitor fleet health at a glance
- Expenses -- Correlate utilization with costs